|
Question 499019: Please tell me how I would graph this. The question is:
Graph the solution set of the following system of inequalities:
x^2+y^2 less than or equal to 25
y greater than or equal to |x|
Found 3 solutions by chessace, Theo, ikleyn:
Answer by chessace(471)   (Show Source): (Show Source):
You can put this solution on YOUR website! The first one results in the inside (and boundary) of a circle with center at (0,0) and radius = 5.
The 2nd one eliminates everything with negative y and everything below the lines y=x (to the right or NorthEast) and y=-x (to the left or NorthWest).
So the final graph will be the border and interior of a "piece of pie", a right angle at the point (0,0), "crust" at the top.
(> rotated 90 degrees clockwise.
Answer by Theo(13342)  (Show Source): (Show Source):
You can put this solution on YOUR website! to graph them, you make the inequality an equality and then you solve for y.
y >= |x| becomes y = |x|.
you can graph it as such.
x^2 + y^2 <= 25 becomes x^2 + y^2 = 25
subtract x^2 from both sides of the equation to get y^2 = 25 - x^2
take the square root of both sides of the equation to get y = +/- sqrt(25 - x^2)
you can graph it as such.
the equations you are graphing are:
y = |x|
y = +/- sqrt(25-x^2)
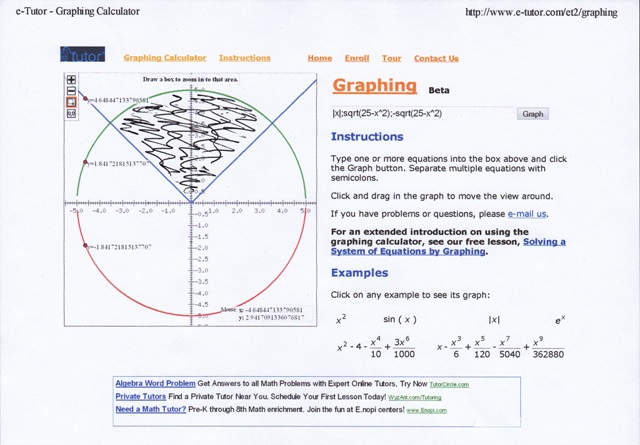
your graph will look like this:
now you have to go back to the inequality and figure out which part of this graph is what you want.
we'll start with y >= |x|
if x is positive, then this is equivalent to y >= x.
if x is negative, then this is equivalent to y >= -x.
regardless of whether x is positive or negative, y will always be positive.
in both cases the value of y will be on the line of the graph or above it.
next we'll work on x^2 + y^2 <= 25
we subtract x^2 from both sides of the equation to get:
y^2 <= 25 - x^2
we take the square root of both sides of this equation to get:
y <= sqrt(25 - x^2) and y >= -sqrt(25 - x^2)
this may be a little hard to see, but it has to be this way in order for y^2 to be smaller than or equal to 25 - x^2.
in our example, we are only concerned with y <= sqrt(x) because we are restricted to positive values of y since y has to be >= |x|.
the shaded area in the graph shows you the area of the graph that is compatible with the requirements of the problem.
y >= |x| puts y above the graph of that equation.
y <= sqrt(25 - x^2) puts y within the boundaries of the circle.
Answer by ikleyn(52830)  (Show Source): (Show Source):
You can put this solution on YOUR website! .
Please tell me how I would graph this. The question is:
Graph the solution set of the following system of inequalities:
x^2+y^2 less than or equal to 25
y greater than or equal to |x|
~~~~~~~~~~~~~~~~~~~~~~~~~~~~~~~~~~~~~
Equation  x^2 + y^2 = 25  describes a circle of the radius of 5 units,
centered at the origin of the coordinate system.


Inequality  x^2 + y^2 <= 25  describes the interior of this circle,
including the circle itself.


Equation y = |x|  describes two rays on the plane.
One ray bisects first quadrant; the other ray bisects the second quadrant.

So, inequality y >= |x|  describes the set of points on the coordinate plane between these rays.


The system of inequalities

    x^2 + y^2 <= 25,

    y >= |x|


describes the intersection of these two sets.


In other words, it is the interior of the circle, which is concluded between the two rays.

All the boundaries are included to the set.
Solved.
|
|
|
| |