Question 490262: I don't even understand this let alone know how to answer it, could someone please explain? it would be really appreciated.
The following is an exponential relationship between unemployment rate, U, and inflation rate, I depicted by the function
I = 24e^(-0.3U)
a. Sketch a graph of this function, for domain 0 ≤ U ≤ 10
b. Rearrange the formula for the above function to make U the subject.
Answer by ankor@dixie-net.com(22740)   (Show Source): (Show Source):
You can put this solution on YOUR website! The following is an exponential relationship between unemployment rate, U, and inflation rate, I depicted by the function
I = 24e^(-0.3U)
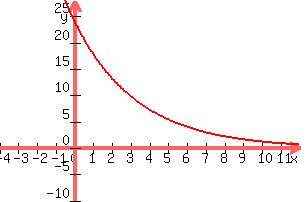
a. Sketch a graph of this function, for domain 0 ≤ U ≤ 10
Rewrite the given equation using x & y, more understandable for graphing it
y = 24e^(-.3x)
They want us to plots this for x=0 to x=10, using a calc, substitute values for x and find y using the given equations, round to the nearest 10th
:
x | y
-------
0| 24;;; y = 24*e^(-.3*0)"
1| 17.8; y = 24*e^(-.3*1)
2| 13.2; y = 24*e^(-.3*2)
4| 7.2;; y = 24*e^(-.3*4)
6| 4.0;; y = 24*e^(-.3*6)
8| 2.2;; y = 24*e^(-.3*8)
10| 1.2;; y = 24*3^(-.3*10)
:
Plot these x/y points, it should look like this:
:
:
b. Rearrange the formula for the above function to make U the subject.
I = 24*e^(-.3u)
divide both sides by 24, and write it:
 = = 
Find the natural log of both sides
 = = 
using the log equiv of exponents
 = =
the ln of e is 1, so we can write it;
-.3u =
divide both sides by -.3
u =  * *
or using decimals we can write it
u = 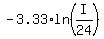
|
|
|