Question 487067: A set of data is normally distributed with a mean of 200 and standard deviation of 50.
· What would be the standard score for a score of 150?
· What percentage of scores is between 200 and 150?
· What would be the percentile rank for a score of 150
Answer by Theo(13342)   (Show Source): (Show Source):
You can put this solution on YOUR website! PROBLEM
A set of data is normally distributed with a mean of 200 and standard deviation of 50.
· What would be the standard score for a score of 150?
· What percentage of scores is between 200 and 150?
· What would be the percentile rank for a score of 150
SOLUTION
here's a reference that might help you understand this better.
http://www.regentsprep.org/Regents/math/algtrig/ATS2/NormalLesson.htm
as far as your problem is concerned, here's how you would solve it.
the z-score tells you how far away from the mean your data point is.
if your data point is at the mean, then it would have a z-score of 0.
the further away from the mean, the greater the z-score, either positive or negative.
if positive, this means the data point is above the mean.
if negative, this means the data point is below the mean.
the distance from the mean is measured in terms of standard deviation.
the data point is +/- x standard deviations above or below the mean.
your data carries the following statistics:
mean = 200
standard deviation = 50
this is what you are given.
you would calculate your z-score as follows:
z-score = (data point minus mean) / (standard deviation)
your first data point translates to a z-score of (150 - 200) / 50 = -50/50 = -1
your first data point is 1 standard deviation below the mean.
your second data point translates to a z-score of (200 - 200) / 50 = 0.
your second data point is 0 standard deviations away from the mean.
this means it is exactly at the mean.
to find the percent of the population that is above or below or between the z-scores of -1 and 0, you need to use a z-table.
we'll use the z-table from the following link.
http://lilt.ilstu.edu/dasacke/eco148/ztable.htm
in this table:
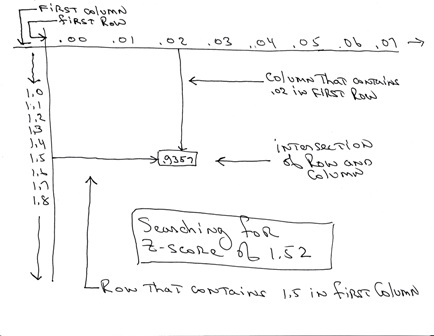
the first column of each row contains the integer part of the z-score and the first decimal place of the z-score.
the first row of each column contains the second decimal place z-score.
for example:
a z-score of 1.52 would show a value of 1.5 in the first column of a specified row and a value of .02 in the first row of a specified column.
the z-score is equal to 1.5 + .02 which is equal to 1.52.
to find the right row and column, you would search down the first row until you hit a row that had 1.5 in the first column and then you would search across the first column until you hit column that had a .02 in the first row.
the value that is in the intersection of the row that contains 1.5 in the first column and the column that contains .02 in the first row would be the value you are looking for.
in this case, the value would be equal to .9357 which means that 93.57% of the data points from your data set would be below 1.5 standard deviations away from the mean.
a picture of how to find the z-score of 1.52 in the z-table is shown below:
we'll use the same technique with your data to solve your problem.
your first data point is -1 deviations away from the mean.
look up a z-score of -1 in the table and find the value for it.
look down the first column of each row until you come to a row that contains a -1.0 in it.
look across the first row of each column until you come to a column that contains a .00 in it.
the intersection of that row and column is the z-score for your first data point.
that value should be equal to .1587.
this means that 15.87% of your data lies below that z-score which means that 15.87% of your data points lie below 150.
your second data point is 0 deviations away from the mean.
look up a z-score of 0 in the table and find the value for it.
look down the first column of each row until you come to a row that contains a 0.0 in it.
look across the first row of each column until you come to a column that contains a .00 in it.
the intersection of that row and column is the z-score for your second data point.
that value should be equal to .5000
this means that 50% of your data lies below that z-score which means that 15.87% of your data lies below 200.
to summarize your findings to this point:
your first data point is 150.
the z-score of your first data point is -1.0
15.87% of your data lies below 150.
100% - 15.87% = 84.13% of your data lies above 150 (to the right of a z-score of -1.0)
your second data point is 200.
the z-score of your second data point is 0.0
50% of your data lies below 200.
100% - 50% of your data lies above 200 (to the right of a z-score of 0).
if you want to find the percent of data points that lie between 150 and 200, then you need to subtract the area to the left of a z-score of -1.0 from the area to the left of a z-score of 0. the difference is the area in between.
the area to the left of a z-score of 0.0 is equal to 50%.
the area to the left of a z-score of -1.0 is equal to 15.87%
50% minus 15.87% = 34.13%.
34.13% of the data points in the study had z-scores between -1.0 and 0.0.
this means that 34.13% of the data points in the study lie between 150 and 200.
we should have enough information to answer your questions.
the questions are:
· What would be the standard score for a score of 150?
The standard score is the same as the z-score and it would be -1.0.
· What percentage of scores is between 200 and 150?
The percentage of scores that lie between 150 and 200 is 34.13%.
· What would be the percentile rank for a score of 150
The percentage rank for a score of 150 would be 15.87%
This means that 15.87% of the data points lie below that score.
a very rough sketch of what your normal distribution curve looks like is shown below:

Comments or questions regarding this solution may be directed to dtheophilis@yahoo.com
|
|
|