|
Question 476141: How do I graph 1/2x-4y=6?
Answer by bucky(2189)   (Show Source): (Show Source):
You can put this solution on YOUR website! I find it easy to work with the slope intercept form of an equation to make the graph. The slope intercept form is:
.

.
where m is the slope (the rise, a positive or negative value, divided by the horizontal distance associated with the rise). And b is the value on the y-axis where the graph crosses.
.
So let's begin by starting with the given equation, and working it around to get it into the slope intercept form.
.
You were given:
.

.
Let's get the term with the y in it to be by itself on the left side of the equation. We can do that by subtracting  from both sides of the equation to get: from both sides of the equation to get:
.

.
Next solve for y by dividing both sides of this equation by -4 and you have:
.

.
This simplifies to:
.

.
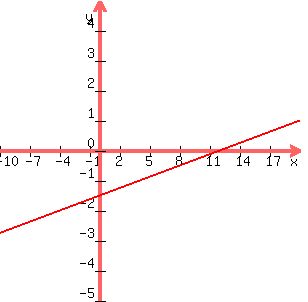
By comparing this with the equation for the point slope form, you can see that the point (b) is -3/2 which means that the graph crosses the y-axis where y is equal to minus 3/2. And you can also see that the slope (m) is the multiplier of x and it equals 1/8. This means that the graph rises 1 unit for every 8 units you go horizontally to the right. Since the slope is positive, the graph rises as you go to the right. If the slope were negative the graph would go down as you went to the right.
.
Next you can start at -3/2 on the y-axis. From this point move 8 units horizontally to the right. You are now at the point (8, -3/2). But since you moved to the right 8 units you know that the graph rises 1 unit (or 2/2 which is equal to 1). Therefore, from -3/2 you go up +2/2 which puts you at -1/2. You are now at the point (8, -1/2) and this point is on the graph. So you now have two points on the graph ... (0, -3/2) and (8, -1/2). If you plot those two points you can then complete the graph by using a straight edge to draw the line connecting the two points and extending beyond them in both directions.
.
When you get done, your graph should look like this:
.
.
Hope this helps you to understand graphing of straight lines a little better.
|
|
|
| |