Question 466507: The function f is defined for 0 ≤ x ≤ 360
f(x) = 3sin(2)x-1.
i) State the amplitude and period of f.
ii) Sketch the graph of f.
*Please explain how you sketch the graph in steps and give the values. Thanks bro :) =)
Answer by lwsshak3(11628)   (Show Source): (Show Source):
You can put this solution on YOUR website! The function f is defined for 0 ≤ x ≤ 360
f(x) = 3sin(2)x-1.
i) State the amplitude and period of f.
ii) Sketch the graph of f.
..
Standard form for the sine function: y=Asin(Bx-C), A=amplitude, Period=2π/B, Phase-shift=C/B
For given sine function: y=3sin(2x-1)
Amplitude=3
B=2
Period=2π/B=2π/2=π
1/4 Period=π/4
Phase-shift=C/B=1/2 (to the right)
Graphing: Use radians for angles
On the x-axis make tick marks starting with 1/2 and 4 more tick marks after that spaced 1/4 period apart, that is, at 1/2, 1/2+π/4, 1/2+π/2, 1/2+3π/4, and 1/2+π.
Changing to decimals, these tick marks are at x=.5, 1.29, 2.07, 2.86, 3.64
you now have the following points to plot the curve:
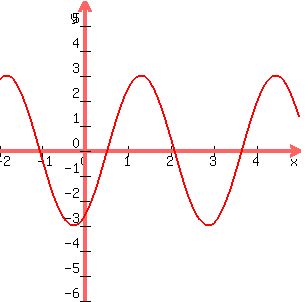
(.5,0), (1.29,3), (2.07,0), (2.86,-3), (3.64,0)
To complete the curve, extend it back to the y-axis
x=0
y=3sin(2x-1)
y=3sin(0-1)=3sin(-1)=3*-.8495=-2.55
(0,-2.55) this is the y-intercept
see graph below as a visual check on answers
|
|
|