Question 427022: I have been reading and trying very hard to get these logarithms, they just make my head spin. I am starting to kind of get the basics, but the book my school uses does not explain things clearly. How would one go about graphing these? Please show all steps so I can try to understand this process from start to finish.
A) y=1/2e^x-1
B) y= -3 log x + 2
Answer by lwsshak3(11628)   (Show Source): (Show Source):
You can put this solution on YOUR website! I have been reading and trying very hard to get these logarithms, they just make my head spin. I am starting to kind of get the basics, but the book my school uses does not explain things clearly. How would one go about graphing these? Please show all steps so I can try to understand this process from start to finish.
A) y=1/2e^x-1
B) y= -3 log x + 2
..
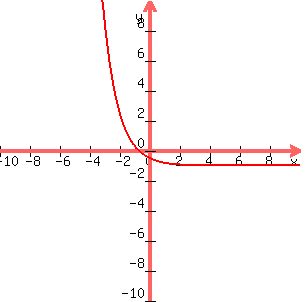
Let us take the first equation, y=1/2e^x-1
Let us break it into its parts.
First, let y=1/e^x
You can see that when x=0, y=1.
This will be true no matter what the base is.
You can also see that as x becomes very large, y approaches zero but does not reach zero. This makes the x-axis an asymptote.
Now we have two things to graph the equation, the point (0,1) and the x-axis as the asymptote.
What happens to the curve when x<0?
The equation will now change from 1/e^-x to e^x. As you can see as x becomes more negative, e^x becomes larger and larger to infinity. So now you should have enough information to graph 1/e^x. But wait we want to graph 1/2e^x-1. No sweat, all we need is a little more algebra. The 2 in the denominator changes the y-intercept from (0,1) to (0,1/2) and makes the curve steeper. The -1 just bumps the entire curve down one unit. This changes the asymptote to y=-1 instead of the x-axis.
That is all there is to it.
..
Let us try the second equation, y= -3 log x + 2
first change -3logx to logx^-3 or log 1/x^3
When x=1,log 1/x^3=log 1/1=log1=0 (Log 1 of any base =0)
So you have this point to graph, (1,0)
As x becomes less than 1, 1/x^3 increases rapidly approaching the y-axis but does not cross the y-axis because there is no such thing as the log of a negative number. So the y-axis becomes an asymptote for the graph. As x becomes greater than 1, you are not taking the logarithim of a fraction which gives you a negative number, so y will become increasingly negative but not as rapidly. The+2 will just bump the entire curve up 2 points.
Hope this helps!
See the graph of the first equation below: The second equation will not graph with this format.
..
|
|
|