graph y=3sinx and y=sin 3x on the same axes.
label the graph of each function.
I know the amp. of first function is 3 and
period is 2p and for second function amp. is 1
and period is 2p/3 i just dont know how to graph
=======================================================
Draw the y-axis long enough to include both amplitudes
as well as the opposite signs of the amplitudes:
3|-
|
2|-
|
1|-
|
0|-----------------------------------------------------------------------
|
-1|-
|
-2|-
|
-3|-
Divide the period of each by 4.
Dividing the first function's period by 4: 2p÷4 is p/2
Multiply this by 0, 1, 2, 3, and 4
0p/2, 1p/2, 2p/2, 3p/2, 4p/2
or, reducing:
0, p/2, p, 3p/2, 2p
Positive sine functions go x-intercept, maximum, x-intercept, minimum,
x-intercept.
Therefore it will have an x intercept at 0, a maximum at p/2,
an x-intercept at p, a minimum at 3p/2 and an x-intercept at 2p
Dividing the second function's period by 4: (2p/3)÷4 is p/6
Multiply this by 0, 1, 2, 3, and 4
0p/6, 1p/6, 2p/6, 3p/6, 4p/6
or, reducing:
0, p/6, p, p/3, 2p/3
Positive sine functions go x-intercept, maximum, x-intercept, minimum,
x-intercept.
Therefore it will have an x intercept at 0, a maximum at p/6,
an x-intercept at p, a minimum at p/3 and an x-intercept at 2p/3
The LCD of periods p/6 and p/2 is 6, so mark off the x-axis in units of
p/6, that is
1p/6, 2p/6, 3p/6, 4p/6, 5p/6, ... , 12p/6
3|-
|
2|-
|
1|-
|
-0|----·----·----·----·----·----·----·----·----·----·----·----·------
| p/6 2p/6 3p/6 4p/6 5p/6 6p/6 7p/6 8p/6 9p/6 10p/6 11p/6 12p/6
-1|-
|
-2|-
|
-3|-
I stopped at 12p/6 because that equals 2p, the larger period.
Reducing the ones of those that will reduce:
p/6, p/3, p/2, 2p/3, 5p/6, p, 7p/6, 4p/3, 3p/2, 5p/3, 11p/6, 2p.
3|-
|
2|-
|
1|-
|
-0|----·----·----·----·----·----·----·----·----·----·----·----·------
| p/6 p/3 p/2 2p/3 5p/6 p 7p/6 4p/3 3p/2 5p/3 11p/6 2p
-1|-
|
-2|-
|
-3|-
Note that those values on the x-axis are about
.5, 1, 1.6, 2.1, 2.6, 3.14, 3.7, 4.2, 4.7, 5.2, 5.8, 6.28
So the two graphs are
 But you should extend the graph of y = sin(3x) to the
length of the period of the graph of y = 3sin(x) like
this:
But you should extend the graph of y = sin(3x) to the
length of the period of the graph of y = 3sin(x) like
this:
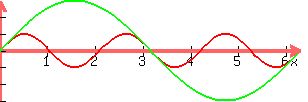 You should also leave the x-axis markings in terms of p,
rather than their numerical values as are on the graphs above.
Edwin
AnlytcPhil@aol.com
You should also leave the x-axis markings in terms of p,
rather than their numerical values as are on the graphs above.
Edwin
AnlytcPhil@aol.com

