Question 394658: The table shows experimental values of two quantities, x and y, which are known to be connected by a law of the form y = k b^x
x 1 2 3 4
y 30 75 190 470
Explain how a straight line graph may be drawn to represent the given equation and draw it for the given data. Hence use this graph, or otherwise, to estimate the value of k and of b.
:)
Answer by richard1234(7193)   (Show Source): (Show Source):
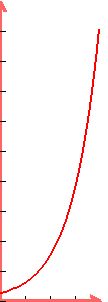
You can put this solution on YOUR website! We can find the exact values of b and k. Since the sequence is geometric, the quotient between two successive y-values (for example 190/75) must be constant. I can tell that the values are rounded, since the quotient is not quite constant, but for each pair of y-values, the quotient is approximately 2.5, so b = 2.5. Also, since 30 = k*(2.5)^1 (using the value (1, 30)) we can get k = 12 (approx.). The graph might look something like this:
The equation is, of course, not linear, but you can use a linear regression to find a line of best fit. However I haven't taken statistics yet, I've only taken the calculus courses at my school :)
|
|
|