Question 367546: 10 liters of a 30% acid solution is obtained by mixing 20% solution with a 50% solution.
a) write a system of equations in which one equation represents the amount of final mixture required and the other represents the amount of the acid in the final mixture. Let x and y represent the amounts of 20% and 50% solutions, respectively.
b) use a graphing utility to graph the two equations in part a. As the amount of the 20% solution increases, how does the amount of the 50% solution change?
c) How much of each solution is required to obtain the specified concentration in the final mixture?
Answer by Theo(13342)   (Show Source): (Show Source):
You can put this solution on YOUR website! x is the amount of liters of the 20% solution.
y is the amount of liters of the 50% solution.
your 2 equations are:
x + y = 10 (number of liters in the solution)
.2x + .5y = .3*10 (amount of acid in the solution).
you solve these simultaneously as follows:
from the first equation, solve for y to get:
y = 10 - x
substitute for y in the second equation to get:
.2*x + .5*(10-x) = .3*10
simplify to get:
.2*x + 5 - .5*x = 3
combine like terms to get -.3*x + 5 = 3
subtract 5 from both sides of the first equation to get:
-.3*x = -2
divide both sides of the equation by -.3 to get:
x = 6.6666666667 (equivalent to 6 and 2/3)
since x + y = 10, this means that y = 3.333333333 (equivalent to 3 and 1/3)
substitute in your original equations to get:
x + y = 6.6666666667 + 3.3333333333 = 10
.2*x + .5*y = .2 * (6.6666666667) + .5 * (3.3333333333) = 3
your solution to the problem is that you need 6 and 2/3 liters of the 20% solution and 3 and 1/3 liters of the 50% solution to get a solution of 10 liters that is 30% acid.
to graph this problem, you need to do the following:
Let x = the number of liters of the 20% solution.
Let y = .2*x + .5*(10-x) which equals the amount of acid in 10 liters of the final solution.
the graph will look like this:

The domain of your graph is the value of x from 0 to 10.
The range of your graph is the value of y from 5 to 2.
you need to look only at the values of x from 0 to 10.
It's clear that when x = 0, y = 5.
That's because your mix is .2*0 + .5*10
It's also clear that when x = 10, y = 2
That's because your mix is .2*10 + .5*0
It is a little less clear that when the value of x = 6.6666666667, the value of y is equal to 3.
It's a little less clear because you can't really narrow the graph down to the value of x = 6.66666667.
You can, however, determine the value of y from the equation for y.
The equation is:
y = .2*x + .5*(10-x)
That becomes:
y = .2*6.666666667 + .5 * (10-6.666666667)
The result of that calculation is that y = 3.
The graph above showed you what happens to the amount of acid in the 10 liters of total solution as the number of liters of the 20% solution increases.
The following graph shows you what happens to the number of liters of 50% solution as the number of liters of the 20% solution increases.
In this graph, the value of x is the number of liters of 20% solution and the value of y is the number of liters of 50% solution.
The formula for y is y = 10 - x.
as x increases, the value of y decreases.
That graph looks like this:
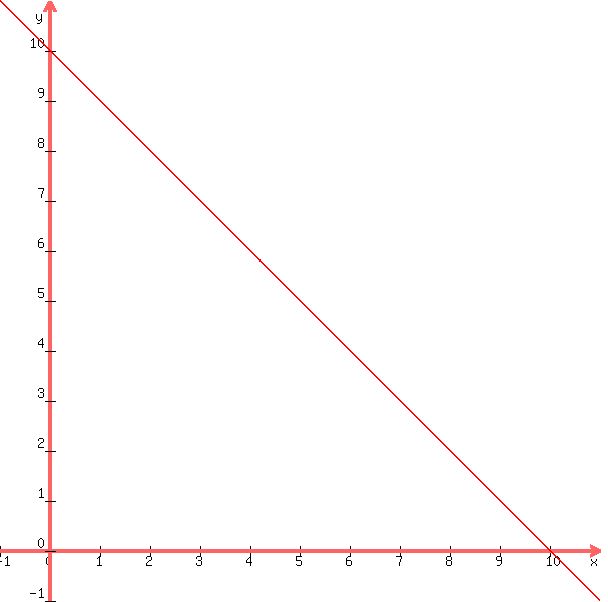
You can see that when the amount of the 20% solution is increased, the amount of the 50% solution decreases.
x is the amount of 20% solution.
y is the amount of 50% solution.
|
|
|