Graph the equation by plotting points.
y = -5
Since the variable x does not appear in the equation,
x can be any number we choose. However the value of
y can only be -5.
So to make a table of values of points, we don't need
to do any calculations, but just pick some arbitrary
values for the x-coordinate, the variable that does not
appear in the equation, and use -5 for the y-coordinate:
x | y | (x,y)
-7 | -5 | (-7,-5)
-4 | -5 | (-4,-5)
1 | -5 | (1,-5)
5 | -5 | (5,-5)
8 | -5 | (8,-5)
So we plot those 5 points:
 Now we just draw a line through all those points (I'll draw it
in green):
Now we just draw a line through all those points (I'll draw it
in green):
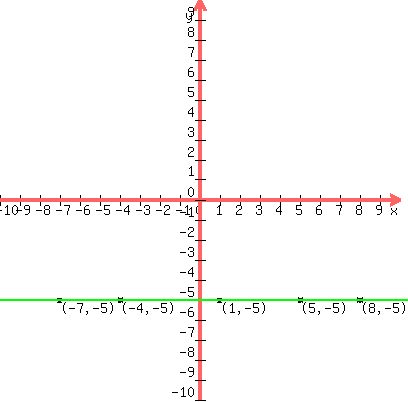 So as you see, it's horizontal, not vertical.
Edwin
So as you see, it's horizontal, not vertical.
Edwin

