|
Question 352424: sketch the graph g(x)=3- square root x+3
Answer by jsmallt9(3758)   (Show Source): (Show Source):
You can put this solution on YOUR website! If the function is

then in the future please put parentheses, "(" and ")", around the expression in the square root (which is called the "radicand". Without the parentheses your function could be interpreted as

Tutors are more likely to help when the problem is clear.
I am guessing that you've been learning how certain changes to an equation change the graph of the equation. If not, then skip the part after the last graph below.
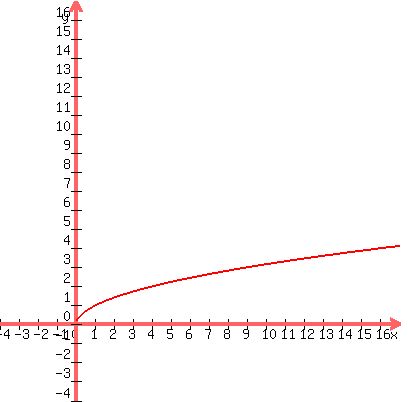
Let's start by looking the the "base" function:

The graph of f is:
The differences between f and g are:- The term of 3 in front of the square root term.
- The minus sign in front of the square root.
- The +3 inside the square root.
The effects on the graph of changes like these are predictable:- The term of 3 in front of the square root term will raise the grapg up three units..
- The minus sign in front of the square root will rotate/spin the graph around the x axis.
- The +3 inside the square root will shift the graph to the left by 3 units.
In short the graph of g will be the graph of f
- shifted up 3 units
- rotated around the x axis
- shifted to the left by 3 units
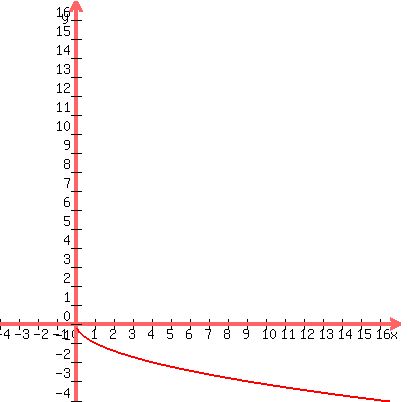
The two shifts should be easy to visualize. But the rotation may be difficult so I will show a graph which is just a rotation of f:
Now, combining all three effects we get the following for the graph of g:
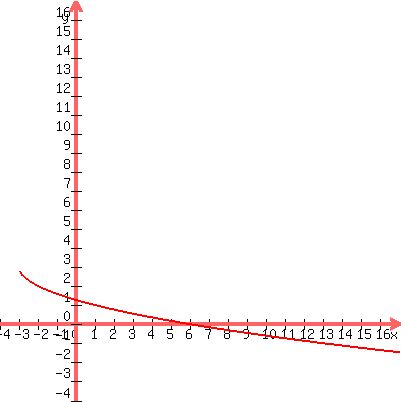 Note: All three graphs should look like half of a sideways parabola (because they are). Note: All three graphs should look like half of a sideways parabola (because they are).
If you are not learning about the above approach to graphing, then you can fall back to the old "find points and plot them" approach. This involves building a table of values by picking values for x and then finding the value of the function for each one. For example,
For x = -3: 
For x = -2: 
For x = 1: 
For x = 6: 
For x = 13: 
These x values give us the points
(-3, 3)
(-2, 2)
(1, 1)
(6, 0)
(13, -1)
(Note how I chose x values that made the square root easy. You could choose other x values, like 0 or 3, but that would have required use of a calculator to find the square roots and I didn't want to bother.)
If the points above are not enough to see how the graph goes, then keep finding and plotting more points until you see how to "connect the dots". This may include x values that require the calculator to find g(x). If properly done, this graph should look like the last one above.
|
|
|
| |