Question 335820: I need help finding the quadratic equation that represents the monthly value of a share of ACME Corp since January 2009. The variable x is to represent the #/months after January and y is to represent the monthly value. I am given a 2 column graph with the MONTH and SHARE VALUE (IN $.) The months are listed as 0,3,5,7,9,11,13, and 15 and the Share Values, in $, are listed as 55,16,0,-8,
-8,0,16,and 40.
Answer by Theo(13342)   (Show Source): (Show Source):
You can put this solution on YOUR website! x represents the number of months after january.
y represents the monthly value.
values for x are:
0,3,5,7,9,11,13,15
values for y are:
55, 16, 0, -8, -8, 0, 16, 40.
If you place the x and y values into (x,y) pairs, you get:
(0,55)
(3,16)
(5,0)
(7,-8)
(9,-8)
(11,0)
(13,16)
(15,40)
It looks like the roots of your quadratic equation are:
x = 5
x = 11
These are the values of x when the value of y is equal to 0.
Your equation will be:
(x-5) * (x-11) = 0
Multiply this out to get:
x^2 - 16x + 55 = 0
This is in the standard form of a quadratic equation of ax^2 + bx + c = 0
In this equation:
a = 1
b = -16
c = 55
The minimum point of this equation is at x = -b/2a which would be 16/2 = 8.
The value for y at this point is found by replacing x with 8 in the equation to get:
8^2 - 16*8 + 55 = 64 - 128 + 55 = -9
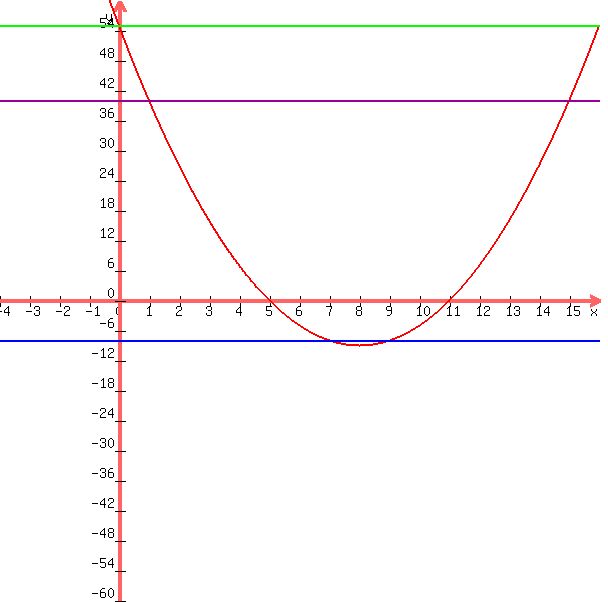
The graph of your equation looks like this:

If you check each point pair, you will see that they conform.
For example:
when x = 0, y = 55
when x = 7, y = -8
when x = 9, y = -8
when x = 15, y = 40
etc.
The following graph with the values of y plotted at 55, -8, and 40, show that more clearly. Just trace a vertical line from the intersection of these line with the line of the equation to see that the values of x are what they should be if the graph of the equation is accurate.
|
|
|