Question 329419: Good Morning,
How do you graph and label equations. This is concerning slope, and y=mx+b. I have Math packets that i can reference to but they dont teach how to label x and y in an equation(based on y=mx+b). Tahnk you
Answer by Fombitz(32388)   (Show Source): (Show Source):
You can put this solution on YOUR website! The x-axis is horizontal.
The y-axis is vertical.
Ordered pairs are presented in (x,y) format.
Point (3,2) is here.

Lines can be presented in slope intercept form,  where where  is the slope and is the slope and  is the y-intercept. is the y-intercept.
The y-intercept is where the line crosses the y-axis.
As an example, here is the graph of  which has a y-intercept of (0,1), which has a y-intercept of (0,1),
.
.
.

.
.
.
You can graph an equation given the slope-intercept form in the following way.
First plot the intercept, (0,b).
Then use the slope to determine another point on the line.
The slope describes the change in y divided by the change in x for each point on the line.
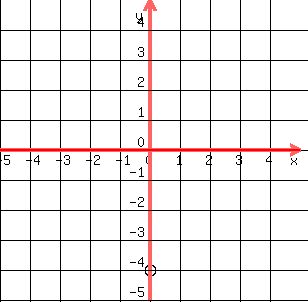
As an example, let's graph 
Plot the point (0,-4)
.
.
.
.
.
.
Next use the slope.
THe slope of the equation is  which means that for each 1 unit change in x, the change in y is 3 units since which means that for each 1 unit change in x, the change in y is 3 units since  . .
So then start at the y-intercept (0,-4) and determine another point.
x:
y:
Another point of the line would be (1,-1).
You can double check by finding the slope using the two points,

So then plot the point (1,-1).
.
.
.

.
.
.
A straight line only needs two points to define it.
Draw the straight line that includes the two points.
.
.
.

.
.
.
So now you have the graph of .
|
|
|