|
Question 328685: Need help!! Im lost, Thanks!
Take a look at the following table:
x -2 -1 0 1 2
f(x) -5 -2 1 4 7
a. Write out an equation for f(x). Assume the function is linear
b. What is the slope? Is it negative or positive? What information do we get from the slope?
2. Suppose you have a cookie stand, and when you charge $3 per cookie box you sell 200 boxes. But when you raise your price to $4 you only sell 120 boxes.
a. Write an equation for the number of boxes you sell as a function of the price you charge.
b. Denote "B" for number of boxes, and "P" for the price you charge.
c. Assume the function is linear.
3. Continuing our lemonade stand question:
a. We all know that total revenue (TR) is a function of the price we charged (P) multiplied by the item quantity sold (in our case � boxes), i.e., TR = Price * Boxes
b. Please write the equation for your TR by inputting your answer from the function you have calculated in question #2 into it.
c. What price would maximize your TR?
Answer by Theo(13342)   (Show Source): (Show Source):
You can put this solution on YOUR website! Lemonade Stand.
revenue = price per box * number of boxes.
If we let r = revenue and p = price per box and b = number of boxes, then this equation becomes:
r = p * b
we have a relationship that says when the price per box is 3, then the number of boxes is 200, and when the price per box is 4, then the number of boxes is 120.
If we let the x axis represent the price and the y axis represent the number of boxes, then we have 2 equations.
We have 2 points on the graph.
They are (x1,y1) = (3,200), and (x2,y2) = 4,120)
We can form a straight line relationship between these two points as follows:
slope = (y2-y1)/(x2-x1) = (120-200)/(4-3) = -80/1.
For every dollar increase in price, we sell 80 less boxes.
To plot this equation, we need to know what the y intercept is.
The point slope formula for a straight line is y = mx + b
m is the slope and b is the y intercept.
we know the slope = -80.
this equation becomes y -80*x + b
we substitute any one of the points to find the y intercept.
we'll use the point (3,200)
substitute for x and y in the point slope form of the equation to get:
200 = -80*3 + b which becomes 200 = -240 + b
solve for b to get b = 440.
our straight line equation is y = -80*x + 440
graph of this equation looks like this:

what this graph is telling us is that if we lower the price to 0 we will sell 440 boxes and if we raisek the price to 5.5 per box, we will sell 0 boxes.
Since this is a linear relationship, the cheaper we make the price, the more boxes we sell.
Maximizing revenue is another story, since if we sell 440 boxes at 0 price per box we make 0.
Likewise, if we sell 0 boxes at 5.50 per box, we also make 0 revenue.
Somehow we need to create an equation that will tell us what our revenue will be and we should be able to plot this equation on a graph.
the equation for revenue is r = p * b which means revenue equals price per box times the number of boxes.
In our first graph, y represented the number of boxes sold and x represented the price per box.
We had y = -80*x + 440.
Since y represented the number of boxes sold, this was equivalent to:
b = -80*x + 440
In our revenue equation, we have r = p * b.
If we substitute x for p, and we substitute (-80*x + 440) for b, then our revenue equation becomes:
r = x * (-80*x + 440).
If we let y now equal r, then our equation becomes:
y = x * (-80*x + 440).
If we multiply the factors out, then we get:
y = -80*x^2 + 440*x.
Since this is a quadratic equation, we can solve for the roots of this equation and we can solve for the minimum and maximum values of y for this equation.
To find the roots, we set this equation equal to 0 to get:
-80*x^2 + 440*x = 0
We divide both sides of this equation by x to get:
x * (-80x + 440) = 0
This equation will be true if either x is equal to 0 or (-80x + 440) is equal to 0.
If we set -80x + 440 = 0, then we get 80x = 440 which makes x = 5.5
The roots of our equation will be when x = 0 or when x = 5.5
A graph of this equation looks like the following:

You can see that the revenue will peak at around $600.
To find the exact value, we use the formula for the maximum / minimum point of a quadratic equation which is:
x = -b/2a
In our quadratic equation of -80x^2 + 440x, we get a = -80 and b = 440 because a is the coefficient of the x^2 term and b is the coefficient of the x term.
We plug these into our formula to get:
x = -(440)/-(160) which makes x = 2.75
When x = 2.75, y = -80*(2.75)^2 + 440*(2.75) = $605.
That's pretty close to what we eyeballed.
That's our maximum revenue.
Since x represents the price per box, then our maximum revenue occurs when the price per box is equal to $2.75.
You can test this out by using the first graph to find the number of boxes sold at a particular price, and then multiplying that number of boxes by the price to get the total revenue.
When the price is 2.00, the number of boxes sold is 280.
280 * 2 = 560.
When the price is 2.50, the number of boxes sold is 240.
2.5 * 240 = 600
When the price is 3.00, the number of boxes sold is 200.
200 * 3 = 600.
When the price is 2.75, the number of boxes sold is 220.
220 * 2.75 = 605.
You can see that the graphs accurately portray the situation.
The key to solving was using the first relationship to help set up the equation for the second relationship.
The first relationship was number of boxes = -80 * price per box + 440.
The second relationship was revenue = price per box * number of boxes.
Substitute for number of boxes from the first relationship to get:
revenue = price per box * (-80 * price per box + 440).
Let x = price per box and y = revenue and you get:
y = x * (-80*x + 440) which is the same equation we derived earlier.
I will now solve the first part of your question.
That is:
Take a look at the following table:
x -2 -1 0 1 2
f(x) -5 -2 1 4 7
a. Write out an equation for f(x). Assume the function is linear
b. What is the slope? Is it negative or positive? What information do we get from the slope?
you have (x,y) pairs as follows (y = f(x)).
                 x      y

(x1,y1)         -2     -5
(x2,y2)         -1     -2
(x3,y3)         0       1
(x4,y4)         1       4
(x5,y5)         2       7
If you look at the change in the value of y for each change in the value of x, you get:
When x increases by 1, y increases by 3.
Since the slope of a straight line equation is the change in y with respect to the change in x, then we can reasonably conclude that the slope is 3/1 = 3.
This is an informal look that will be confirmed formally.
You should know the point slope formula for a straight line.
That is y = m*x + b where m is the slope and b is the y-intercept.
We can take any of the points shown and form the equation for a straight line.
Let's take (x1,y1) and (x5,y5)
We get (x1,y1) = (-2,-5) and:
we get (x5,y5) = (2,7)
The slope of a straight line is given by the equation:
(y2-y1)/(x2-x1)
Since we can use any point on the line, then the following equation is equally valid:
slope = (y5-y1)/(x5-x1) which becomes:
m = slope = (7 - (-5)) / (2 - (-2)) which becomes:
m = slope = 12 / 4 = 3.
Our equation of y = m*x + b becomes y = 3*x + b
To find b, which is the y-intercept, we choose any point on the line and substitute it for x and y in this equation.
We'll choose (x3,y3).
Any other point is valid, so neither is better or worse than the other.
Since (x3,y3) = (0,1), then our formula of y = 3*x + b becomes:
1 = 3*0 + b which becomes 1 = b.
Our point slope formula now becomes:
y = 3*x + 1
A graph of this equation looks like this:
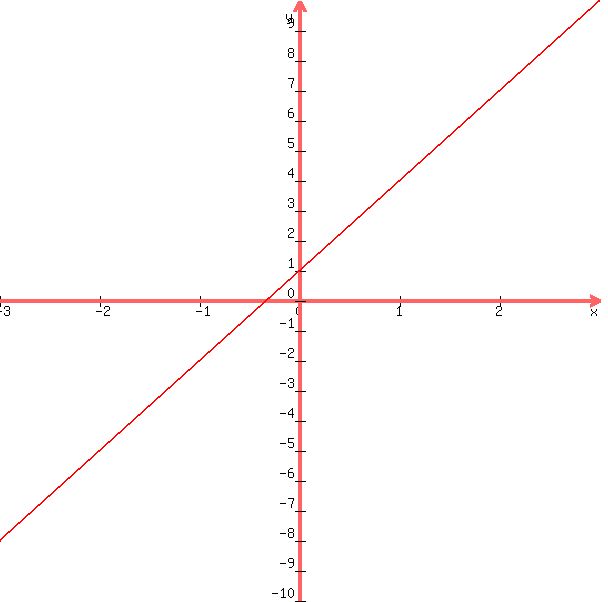
From this graph, you can see that the values of y are as shown in the table for each value of x.
That means the equation is good.
|
|
|
| |