|
Question 322784: graph y>3x-4
Answer by jim_thompson5910(35256)   (Show Source): (Show Source):
You can put this solution on YOUR website! First, we start off by graphing the line 
Looking at  we can see that the equation is in slope-intercept form we can see that the equation is in slope-intercept form  where the slope is where the slope is  and the y-intercept is and the y-intercept is 
Since  this tells us that the y-intercept is this tells us that the y-intercept is ) .Remember the y-intercept is the point where the graph intersects with the y-axis .Remember the y-intercept is the point where the graph intersects with the y-axis
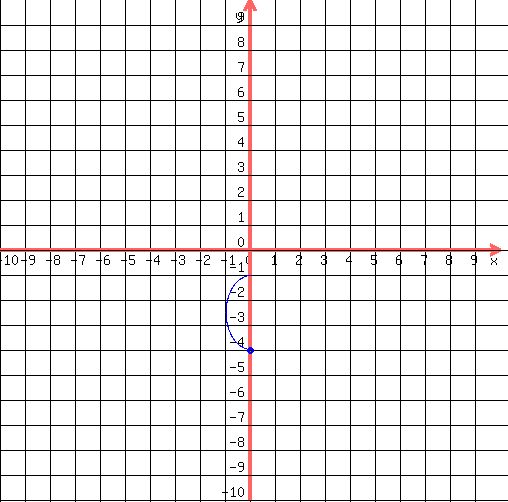
So we have one point )

Now since the slope is comprised of the "rise" over the "run" this means

Also, because the slope is  , this means: , this means:

which shows us that the rise is 3 and the run is 1. This means that to go from point to point, we can go up 3 and over 1
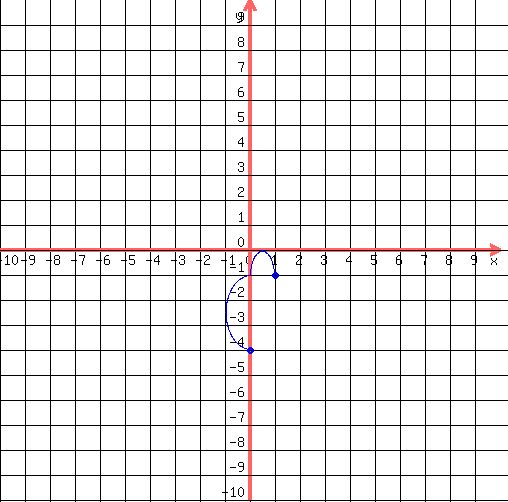
So starting at ) , go up 3 units , go up 3 units

and to the right 1 unit to get to the next point )

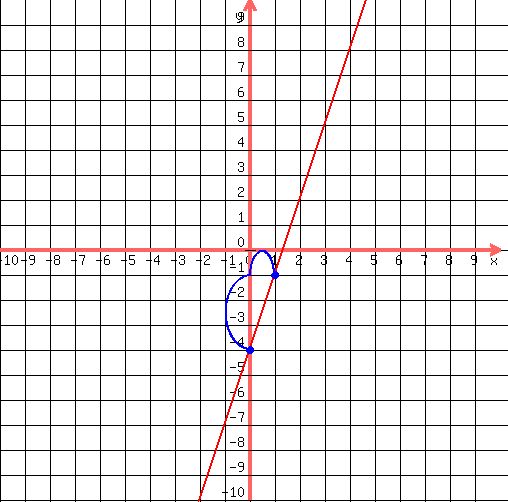
Now draw a line through these points to graph 
 So this is the graph of So this is the graph of  through the points through the points ) and and )
Now because the inequality sign is a greater than sign " > ", this means that the line is going to be a dashed line (but I can't show that here).
----------------------------------------------------------
Now let's select a test point, say (0,0). So plug in x=0 and y=0 into  to get to get  and then simplify that to get and then simplify that to get 
Since  is true, this means that we shade the entire region that contains (0,0) like this: is true, this means that we shade the entire region that contains (0,0) like this:

So the graph of  is the one shown above. Note: the shaded area represents the green lines and that entire area should be green. is the one shown above. Note: the shaded area represents the green lines and that entire area should be green.
|
|
|
| |