Question 31139: x -2 -1 0 1 2
y .25 .5 1 2 4
Given the table above, graph the function, identify the graph of the function (line, parabola, hyperbola, or exponential), explain your choice, and give the domain and range as shown in the graph, and also the domain and range of the entire function.
I am lost, this stuff is going right over my head and I dont know where to begin.
Found 2 solutions by mbarugel, josmiceli:
Answer by mbarugel(146)   (Show Source): (Show Source):
You can put this solution on YOUR website! Hello!
The graph would look something like this:
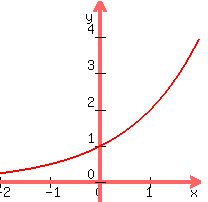
This is an exponential function: for each unit that x increases, y is multiplied by a fixed value. In your case, notice that each time x increases by 1, y is multiplied by 2. This is a feature of exponential functions. In fact, this table probable comes from the function  . .
The domain and range, as given from your table (and thus in the graph) are:
Domain: [-2, 2] (the values of X go from -2 to 2)
Range: [0.25, 4] (the values of Y go from 0.25 to 4)
For the entire function, the domain is all values of X, from -infinity to +infinity.
The range is (0, +infinity) - notice that in the formula I wrote above,  cannot take on negative values, so the whole function can't be negative. That's why the lower bound of the range is 0. Notice also that the 0 is not included - there is no X for which is zero. cannot take on negative values, so the whole function can't be negative. That's why the lower bound of the range is 0. Notice also that the 0 is not included - there is no X for which is zero.
I hope this helps!
Get more answers at Online Math Answers.com!
Answer by josmiceli(19441)  (Show Source): (Show Source):
You can put this solution on YOUR website! x ______-2______-1______0_______1_______2
y ______.25______.5 _____1_______2_______4
Don't feel bad. It took me a little while, too. I probably tried some
things you thought of like, is it y = 2x? No, because when x is 0
how can y = 1? The minus signs really threw me, too.
------------------------
Then a dim light flickered. . . exponents, logs, something about negative
exponents
So I tried y = 2^x
bingo!
x_______-2______-1______0_______1_______2
2^x_____.25______.5______1_______2_______4


Remember, the rule for negative exponents is

This is an exponential equation. y changes exponentially with x
---------------------------
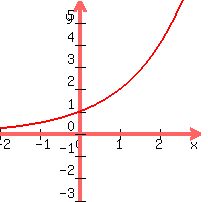
OK, I want to graph this thing from (-2, .25) to (2,4)
(these are the (x,y) points at the ends of the chart
----------------------------
the domain of the data given would be it's extent on the x-axis
That would be -2 to +2
The range is the extent on the y-axis
That would be .25 to 4
------------------------------
What's the domain and range of the entire function?
That means how far can x and y possibly go?
I can make x any number I want, no problem,
So the domain is minus infinity to plus infinity
But what happens to y (2^x) when I do this?
Y goes from a very, very small positive number to infinity
2^x can never be negative
So the range of the entire function is zero to plus infinity
|
|
|