Question 308741: I need help with this question. I am so lost!!
Graph the following equation and identify the y-intercept of y=x+3?
Found 2 solutions by Fombitz, rapaljer:
Answer by Fombitz(32388)   (Show Source): (Show Source):
Answer by rapaljer(4671)  (Show Source): (Show Source):
You can put this solution on YOUR website! You probably need a complete explanation of graphing, which includes intercepts and slope. I have a video from a few years ago before I retired that is accessible FREE on my website. To find my website, click on my tutor name "rapaljer" anywhere in algebra.com. Look for the link on my homepage that says "Rapalje Videos in Living Color." Click on "Basic Algebra" and look for the video called "Graphing and Slope of a Line." You may need to download RealPlayer if you do not already have this, but it is FREE and very easy to do.
I have other explanations of this topic on the website also. Look on my Homepage for the link "Basic, Intermediate and College Algebra: One Step at a Time." Click on "Basic Algebra" and look in Chapter 5 for a complete written explanation.
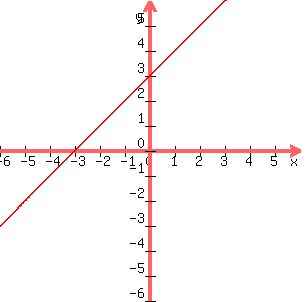
In answer to your question, the y-intercept is the value where the graph crosses the y-axis. It's the value where x=0. In this case where y=x+3, if x=0, then y=3, so this is the y-intercept.
To get the graph, choose some other values of x, and find the value of y that goes with it. For example, if x=1, then y=1+3=4. If x=2,then y=2+3=5. Graph all of these points on an xy-graph, and connect the dots. It should look like this:
I hope this is helpful to you.
Dr. Robert J. Rapalje, Retired
Seminole State College of Florida
|
|
|