Question 28612: I am having some serious problems understanding this part of my algebra course. Can you help me figure out this problem and maybe explain how you got the answer. Thanks for all of your help.
A budget line shows all of the different combinations of goods a person can buy with a given budget, B. If a given company has $500.00 to spend on 2 goods "a" and "b" and a= $50.00 and b= $10.00, graph the budget line using the equation ax + by = B
Answer by venugopalramana(3286)   (Show Source): (Show Source):
You can put this solution on YOUR website! A budget line shows all of the different combinations of goods a person can buy with a given budget, B. If a company has $500.00 to spend on 2 goods, "a" and "b" and "a" = $50.00 and "b" = $10.00, graph the budget line using the equation ax + by = B I tried this and got the following did I do this correctly?
ax + by = B..CORRECT..BUT FIRST GIVE X=NO.OF 'a' GOODS BOUGHT AND Y=NO.OF 'b' GOODS BOUGHT
ax + by = 500...OK
50x + 10y = 500...OK
10y = 500 - 50x..OK
y = 50-5x...OK
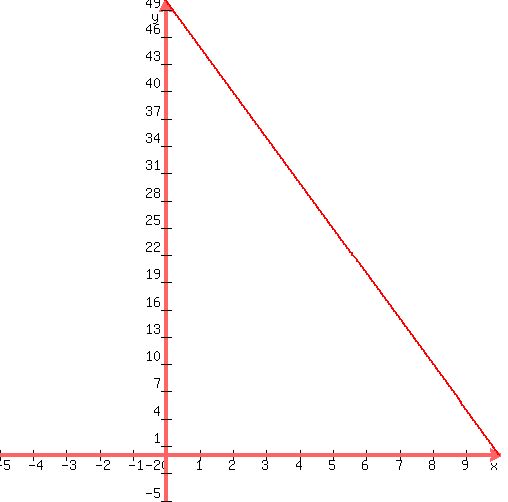
I used -1, 0, 1 in my xy axis table..OK...FOR X VALUES YOU WRITE...MATHEMATICALLY OK..BUT JUST THINK PHYSICALLY?CAN YOU BUY NEGATIVE QUANTITY OF GOODS ..SO YOU BETTERR TAKE ONLY POSITIVE VALUES FOR X AND Y ..THAT IS X>=0 BUT <=10 AS OTHERWISE Y WILL BECOME NEGATIVE...SO TAKE 10 INSTEAD OF -1 FOR X.
I came up with three ordered pairs of (-1,55) (0,50) (1,45)..EXCELLENT..AS TOLD ABOVE DROP (-1,55) AND PUT (10,0)INSTEAD...GO AHEAD AND PLOT THEM TO A SUITABLE SCALE WITH CONFIDENCE .THE GRAPH WILL LOOK LIKE THIS..
|
|
|