|
Question 280164: I just need help in how to graph this problem What would be the break-even point if a firm set a unit selling price of $100 when total fixed costs were $100,000 and varable costs per unit were $80.
Answer by stanbon(75887)   (Show Source): (Show Source):
You can put this solution on YOUR website! I just need help in how to graph this problem What would be the break-even point if a firm set a unit selling price of $100 when total fixed costs were $100,000 and varable costs per unit were $80.
-----------------------------
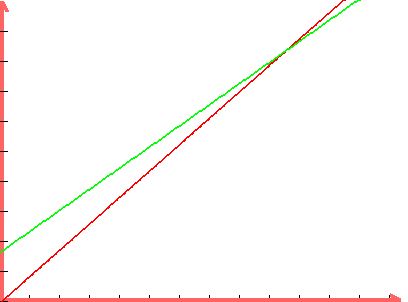
Revenue = 100x
Cost = 80x + 100,000
-------------------------
Graph y = 100x
If x = 0, R = 0 giving you point (0,0)
If x = 5, r = 500 giving you point (5,500)
---
Plot those two points and draw a line thru them.
That is the Revenue graph
----
Graph y = 80x + 100,000
If x = 0, y = 100,000 giving you point (0,100000)
If x = 5, y = 80*5+100000 = 100400 giving you pont (5,100400)
Plot the two points and draw a line thru them
That is the Cost graph.
------------------------------------
----
The intersection is where 100x = 80x+100,000
20x = 100000
x = 5000
There y = 100*5000 = 500,000
-------------------
Cheers,
Stan H.
|
|
|
| |