|
Question 259830: Graph each equation. Please show the work of getting the answer.
Let x= -3,-2,-1,0,1,2,3,
y=x-2
Answer by jim_thompson5910(35256)   (Show Source): (Show Source):
You can put this solution on YOUR website! Simply plug in the x values of -3,-2,-1,0,1,2, and 3 into y=x-2 separately to find the corresponding y values. You'll get a series of points in which you can then plot and draw a line through to graph y=x-2
Here's another way to do it.
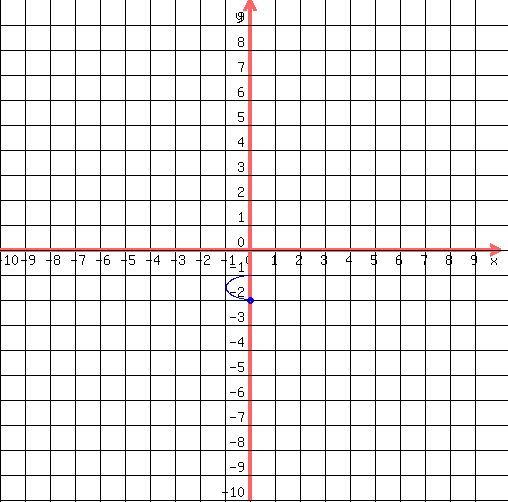
Looking at  we can see that the equation is in slope-intercept form we can see that the equation is in slope-intercept form  where the slope is where the slope is  and the y-intercept is and the y-intercept is 
Since this tells us that the y-intercept is ) .Remember the y-intercept is the point where the graph intersects with the y-axis .Remember the y-intercept is the point where the graph intersects with the y-axis
So we have one point

Now since the slope is comprised of the "rise" over the "run" this means

Also, because the slope is  , this means: , this means:

which shows us that the rise is 1 and the run is 1. This means that to go from point to point, we can go up 1 and over 1
So starting at , go up 1 unit
and to the right 1 unit to get to the next point )

Now draw a line through these points to graph
 So this is the graph of through the points and So this is the graph of through the points and
|
|
|
| |