Question 25560: how do you graph a function? for example, g(x)=2x-3
thank you
Answer by rapaljer(4671)   (Show Source): (Show Source):
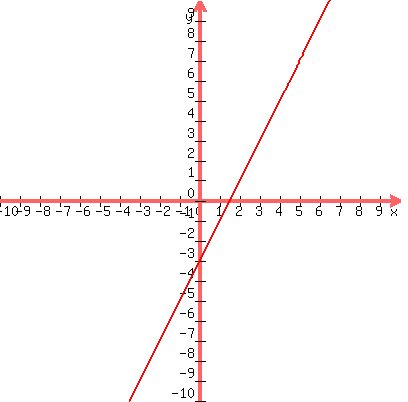
You can put this solution on YOUR website! This is just like y = 2x-3, which is a straight line. You can make a table of values and graph the points on an xy axis, or you can use the fact that the y intercept is the number term which is -3, and the slope is 2, which means  . See my lesson plans on graphing straight lines, especially with the slope intercept form of the line. . See my lesson plans on graphing straight lines, especially with the slope intercept form of the line.
Graph the point (0,-3) by going down on the y axis 3 units. Then with your pencil on this point measure UP 2 units, then RIGHT 1 unit, and put a point. Connect the points with a line, and it should look like this:
R^2 at SCC
|
|
|