Hi Lindsey,
This is my first go at answering a problem, but I'll do my best and hopefully we'll both get something out of it.
I think from you're question that we're talking about inequalities that look something like:

Where a, b, c, d are constants, and x, y are the two variables in your graph. Of course it doesn't have to be less than, it could be any inequality, but the idea is the same.
For each possible coordinate the inequality is going to be either true or false, so the x-y plane is somehow going to be divided into two halves. The half where the inequality is true, and the half where it is false. Lets call these two halves (or regions)  where the inequality is true and
  where the inequality is false.
Lets imagine that we can find the border between the two regions. Once we know where the border is then solving the problem is trivial. Take the example

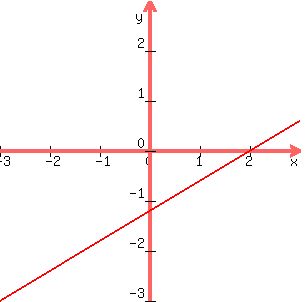
Now I'll tell you that the border between the two regions is the straight line

the graph of this looks like:
All we have to do is decide which side of the line is and which side is . To do this we pick a point in one of the regions and see if it satisfies the inequality. Let's try the origin, because zero is my favourite number :)
At  and
and  then
then  is false. So the part of the graph containing the origin must be hence the other side of the line is .
I don't know how to shade in a graph here, but you can go and shade in on your graph. Also you need to work out if the line is in , but that's easy. Just pick a point on the line and try it.
I'm sure you don't need to know why this works, but think about it like this. Take the inequality  and lets imagine that we are in One way to get into is by increasing
  .
.  is the largest value can have and still be in so
  must be on the border.
Ok, so now hopefully you can do it. Let's try an example before I go.

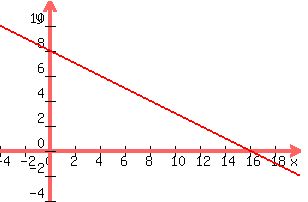
First thing to do is find the border, it is given by

Rearrranging this gives

The graph of this line looks like
Now we just pick a point in one of the regions, the origin looks easy 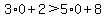 is false, so the origin is in and you shade the other side of the line
If the origin is on the line, then you can't use it. If you don't believe me try the inequality  but you can choose any point you like in either region.
I hope this was helpful, if you don't understand anything please get back to me
Kev


 (
(