|
Question 23201: Here is another type of graph. I am getting very confused. In my text book it shows different symbols but does not explain what they are. There are arrows that go both ways, however there are o's that are blacked out, has either a diagonal line or an x going through the o's. What do they mean? Our text book does not explain much, it assumes that everyone is not a re-beginner with algebra.
Solve and graph the solution set. 8x + 8 > 7x + 9
Thank you for your time and help
Sherri
Found 3 solutions by venugopalramana, stanbon, rapaljer:
Answer by venugopalramana(3286)   (Show Source): (Show Source):
You can put this solution on YOUR website! --------------------------------------------------------------------------------
Solve and graph the solution set. 8x + 8 > 7x + 9
DONT GET UPSET .TRY TO LEARN WITH A COOL MIND AND YOU WILL BE THE MASTER.I AM GIVING THE SOLUTION FOR YOUR PROBLEM AND FEW OTHER EXAMPLES FOR YOU TO READ AND UNDERSTAND.COME BACK TO ME IF YOU DONOT UNDERSTAND.
HERE WE HAVE 8X+8>7X+9
8X-7X>9-8
X>1
TO DRAW THE GRAPH ,AS A FIRST STEP TAKE
X=1 AND PLOT IT .SINCE X=1 IS CONSTANT ALWAYS ,IT MEANS THAT WHATEVER MAY BE THE VALUE OF Y X IS ALWAYS 1..LET US TABULATE FOR PLOTTING
X...1....1....1.....1.....1.......ALWAYS 1 AS X=1
Y...0....1....2.....-1....-2...ETC...FOR ANY VALUE OF Y
THE GRAPH WILL LOOK LIKE THIS
GREEN LINES ARE X AND Y AXES..THE COLOURED VERTICAL LINE IS THE GRAPH OF X=1

YOU GET A VERTICAL STRAIGHTLINE PERPENDICULAR TO X AXIS AT X=1.WHICH IS THE GRAPH OF X=1.WHATEVER MAY BE THE VALUE OF Y......ON THIS LINE ANY POINT WILL SATISFY THE GIVEN EQUATION X=1.
NOW LET US SEE WHAT THE GRAPH IS FOR X>1
NOW WE FIND THAT ORIGIN IS ON ONE SIDE OF THE LINE.LET US TEST THE ORIGIN IN THE ABOVE EQN.WE FIND THAT AT ORIGIN ,
X=0 AND SO X<1...HENCE THE REGION FROM THE LINE TOWARDS OR IN THE DIRECTION TOWARDS ORIGIN IS FOR X<1.BUT WE WANT THE REGION WHERE X>1....OBVIOUSLY ,IT IS THE REGION FROM THE LINE SPREADING TO THE OTHERSIDE OR POINTING AWAY FROM THE ORIGIN . HENCE THE GRAPH OF X=1 IS THE BORDER LINE WHICH SEPERATES THE X-Y PLANE IN TO 2 PARTS OR 2 ZONES.THE ZONE TOWARDS ORIGIN IS WHERE X<1 AND THE OTHER ZONE IS WHERE X>1.SAME LOGIC APPLIES TO ALL OTHER CASES DISCUSSED BELOW.TO CLEAR YOUR DOUBT WHERE Y> OR < SOME GIVEN FUNCTION OF X , YOU CAN TEST BY EASY SUBSTITUTION OF ORIGIN (X=0 AND Y=0)TO TEST THE ZONE TOWARDS ORIGIN IS THE > OR < SIDE.
************************************************************************
how do you graph this equation y>3x+4
1 solutions
--------------------------------------------------------------------------------
Answer 11555 by venugopalramana(565) on 2005-12-22 10:59:37 (Show Source):
Y>3X+4...PLOT Y=3X+4 AS USUAL BY GIVING DIFFERENT VALUES TO X AND FINDING Y AS TABULATED BELOW
X.......0........1........2...........-1...........-2
Y.......4........7........10...........1...........-2
THE GRAPH WILL LOOK LIKE THIS
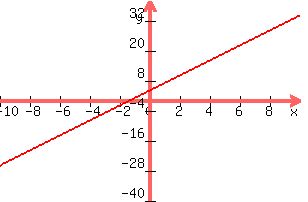
YOU GET A STRAIGHTLINE.....ON THIS LINE ANY POINT WILL SATISFY THE GIVEN EQUATION .NOW WE FIND THAT ORIGIN IS ON ONE SIDE OF THE LINE.LET US TEST THE ORIGIN IN THE ABOVE EQN.WE FIND THAT
Y=0 AND 3X+4=3*0+4=4...SO Y<3X+4...HENCE THE REGION FROM THE LINE TOWARDS OR IN THE DIRECTION TOWARDS ORIGIN IS FOR Y<3X+4.BUT WE WANT THE REGION WHERE Y>3X+4....OBVIOUSLY ,IT IS THE REGION FROM THE LINE SPREADING TO THE OTHERSIDE OR POINTING AWAY FROM THE ORIGIN .
-----------------------------------------------------------------
AS PER EXAMPLES ABOVE YOU CAN PLOT THE GRAPHS FOR FIRST 4 EQUALIT1ES
3X+4Y=12
X+3Y=6
X=0
Y=O
AND THEN SHADE THE ZONES PERTAINING TO THE INEQUALITIES
3x + 4y < 12
x + 3y < 6
x > 0
y > 0
AFTER SHADING ALL THE ZONES ,SEE THE COMMON ZONE WHICH SATISFIES ALL THE CONDITIONS .THAT IS YOUR SOLUTION ZONE .IF YOU GET INTO ANY DIFFICULTY COME BACK AND I SHALL GIVE YOU MORE DETAILED AND SPECIFIC ANSWER TO YOUR PROBLEM.BUT FIRST TRY TO UNDERSTAND THE METHODOLOGY AND INFORM WHETHER YOU GOT IT OR STILL DOUBTS EXIST.NOTE THAT X>0 AND Y>0 INDICATE THAT SOLUTION ZONE IS ONLY IN THE FIRST QUADRANT WHERE X AND Y ARE POSITIVE.YOU WILL GET AT THE SAME RESULT BY FOLLOWING THE LOGIC GIVEN BY ME.
--------------------------------------------------------------------------------
SEE EXAMPLES ABOVE TO PLOT THE GRAPHS FOR FIRST 2 EQUALIT1ES
x + 2y = 3
2x � 3y = 6
AND THEN SHADE THE ZONES PERTAINING TO THE INEQUALITIES
x + 2y < 3
2x � 3y < 6
AFTER SHADING ALL THE ZONES ,SEE THE COMMON ZONE WHICH SATISFIES ALL THE CONDITIONS .THAT IS YOUR SOLUTION ZONE .IF YOU GET INTO ANY DIFFICULTY COME BACK AND I SHALL GIVE YOU MORE DETAILED AND SPECIFIC ANSWER TO YOUR PROBLEM.BUT FIRST TRY TO UNDERSTAND THE METHODOLOGY AND INFORM WHETHER YOU GOT IT OR STILL DOUBTS EXIST.
Answer by stanbon(75887)  (Show Source): (Show Source):
You can put this solution on YOUR website! Check "worked problems" in your text to see what
those slashes and x's mean.
Problem:
8x+8>7x+9
Substract "8" from both sides to get:
8x> 7x+1
Substract "7x" from both sides to get:
x>1
Draw a number line; mark the zero; determine "1".
Draw an open circle at "1" to indicate it is not
part of the solution. Draw an arrow to the right
starting at the open circle. That is the graph
of x>1
Cheers,
Stan H.
Answer by rapaljer(4671)  (Show Source): (Show Source):
You can put this solution on YOUR website! I can't quite envision all the notation that is giving you trouble, and I haven't yet been able to get the section from my One Step online yet because of the graphing. I can send you a Word file containing this section that might be easier to understand. For now, at least, here is your current problem:
8x+ 8 > 7x + 9
Subtract 7x from each side:
8x-7x + 8 > 7x - 7x + 9
x+ 8 > 9
Now subtract 8 from each side:
x+8-8 > 9-8
x>1
This means that the solution set consists of all values of x (on a numberline) that are to the right of 1. This would be like 2, 3, 4, 5, etc. including all fractional and decimal values as wll. It goes right up to the 1, but it does NOT include the 1. There are different notations for this. Sometimes they put an open circle on the 1 and shade everything to the right of this open circle.
If the answer had been  , then this means everything to the right of 1 but in this case it also INCLUDES the 1. We represent this with a SOLID circle, and shade everything to the right. , then this means everything to the right of 1 but in this case it also INCLUDES the 1. We represent this with a SOLID circle, and shade everything to the right.
Another notation for NOT including the endpoint, instead of the open circle, is to use a parenthesis on the 1, where the parenthesis curves in the direction of the shaded region on the numberline.
The corresponding notation that means to INCLUDE the endpoint would be to use a BRACKET [ instead of parenthesis opening in the direction of shading.
If the solution to the problem happens to be all values of x, then you have a numberline shaded with arrows on each end. This means all real values of x.
If there is NO SOLUTION, then they probably used the greek letter for "phi", which is a 0 with a line through it like this:  . .
Maybe that will help some. Sorry I can't see your book.
R^2 at SCC
|
|
|
| |