Question 223651: How do I plot the graph of
 ? I remember the slope-intercept formula, but don't know what to do when x has an exponent. Thank you, in advance. ? I remember the slope-intercept formula, but don't know what to do when x has an exponent. Thank you, in advance.
Answer by stanbon(75887)   (Show Source): (Show Source):
You can put this solution on YOUR website! How do I plot the graph of
? I remember the slope-intercept formula, but don't know what to do when x has an exponent.
------------------------------------
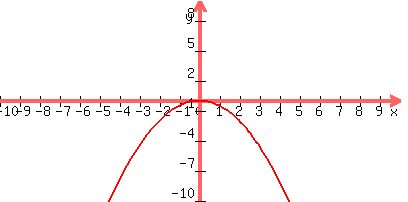
y = (-1/2)x^2
-------
Plot points and draw a smooth curve thru them:
Let x = -2, then y = (-1/2)(-2)^2 = -2
Let x = -1 , then y = (-1/2)(-1)^2 = -1/2
Let x = 0 , then y = (-1/2)(0)^2 = 0
Let x = 1 , then y = (-1/2)(1)^2 = -1/2
Let x = 2 , then y = (-1/2)(2)^2 = -2
==========================================
So you have points (-2,-2)(-1,-1/2)(0,0)(1,-1/2)(2,-2)
==========================================
Cheers,
Stan H.
|
|
|