|
Question 182660: The national cost C in billions of dollars for dental services can be modeled by the linear equation C= 2.85n + 3052, where n is the number of years since 1990.
a) find and interpret the C-intercept for the line
b) find and interpret the n-intercept for the line
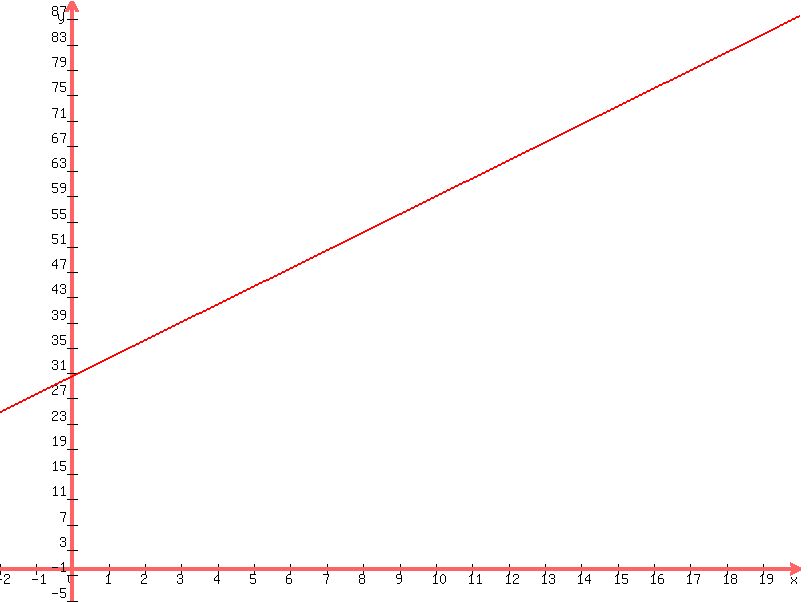
c) graph the line for n ranging from 0 through 20
d) if this trend continues, then in what year will the cost of dental services reach 100 billion?
This is what I have so far for an answer:
I tried to solve for C. I began by subtracting 1990 from this current year 2009 which gave me 19, so n=19. Then I was able to solve for C.
C= 2.85(19) + 3052
C= 54.15 + 30.52
C= 84.67
a) n=0, then C=2.85(0) + 30.52. C-intercept is (0, 30.52)
b) C=0, then 2.85n + 30.52 = 0 Here's my work for this equation:
2.85n + 30.52 - 30.52 = 0 -30.52
2.85n/2.85 = -30.52/2.85
n=-10.70
n-intercept is (-10.70, 0) or is the n-intercept (19, 84.67)?
d)I think I have to substitute C for 84.67 which will allow me to solve the equation for n. Below is what I did.
C= 2.85n + 30.52
8467= 2.85n + 30.52
-30.52 - 30.52
54.15= 2.85n
54.15/2.85 = 2.85n/2.85
n=19
So will the year be 2019 since n=19?
Answer by Mathtut(3670)   (Show Source): (Show Source):
You can put this solution on YOUR website! A) Find and interpret the C-intercept for the line
C = 2.85n + 30.52
:
C = 2.85(0) + 30.52
C = 30.52......(0,30.52)
At zero years, the C-intercept is at $30.52 billion.
B)Find and interpret the n-intercept for the line
C = 2.85n + 30.52
0 = 2.85n + 30.52
-30.52 = 2.85n
-30.52/285 = n
-10.70= n (-10.70,0) remember in an x intercept(n in our case) y is always zero.
n intercept means in 1979 , the cost was zero.
C)Graph the line for n ranging from 0 through 20
D If this trend continues, then in what year will the
cost of dental services reach 100 billion?
C = 2.85n + 30.52
100 = 2.85n + 30.52
69.48 = 2.85n
About 24.37 years later:
so between 24 and 25 years it will reach 100 billion
Year: 2014-2015
|
|
|
| |