|
Question 1787: Sketch the graph of each function. state the domain and range, and whether the function is increasing or decreasing. identify any aysmptotes.
f(x)=2^x-3
Answer by longjonsilver(2297)   (Show Source): (Show Source):
You can put this solution on YOUR website! i am assuming the equation is  and not and not 
so, it is a log graph...you should learn how a log or exponential graph looks.
Always look for "obvious" points on any sketching...usually where x=0 and where y=0, although in exponentials, it is better to find where y=1 usually.
so, if x=0, then y=1/8.
if y=1, then x=3.
the curve never quite reaches the x-axis on the -ve x-side...put in a large -ve x-value and you will see this.
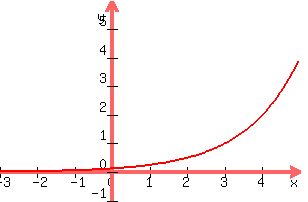 . .
the graph is increasing and has an asymptote at x=0, as the function
sorry, i missed off the domain and range...
domain is xeR (ie all real values of x)
range is yeR, y>0 (ie all real values greater than 0, since no -ve y values are possible...nor is zero).
cheers
Jon.
|
|
|
| |