Question 175589This question is from textbook algebra structure and method
: can you please help me solve and graph:  This question is from textbook algebra structure and method
Answer by EMStelley(208)   (Show Source): (Show Source):
You can put this solution on YOUR website! The first step in graphing a linear inequality is to pretend that the greater than or equal to sign is just an equal sign,  , and graph the line. You can do this different ways, such as identifying two points, and connecting the line between them. The most common way is to just the y-intercept and the slope. In this case, the y-intercept is (0,1), which is found by setting x=0. The slope of the line is 2, found by remembering that y=mx+b is the slope-intercept form of a line, and m is the slope. So you can plot the point (0,1) and go up 2, over 1 to attain the "next" point. Thus, we get , and graph the line. You can do this different ways, such as identifying two points, and connecting the line between them. The most common way is to just the y-intercept and the slope. In this case, the y-intercept is (0,1), which is found by setting x=0. The slope of the line is 2, found by remembering that y=mx+b is the slope-intercept form of a line, and m is the slope. So you can plot the point (0,1) and go up 2, over 1 to attain the "next" point. Thus, we get
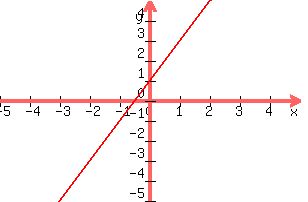
Remember that the line extends indefinitely up and down. Since we are dealing with an inequality and not an equality, either the area above the line will be shaded, or the area below the line will be shaded. The easiest way to check this is to find a point that is not on the line, for example, in this case, the origin (0,0) is not on the line, so we can use that. Plug this point into the inequality and we get  or or  . This is a false, statement, and the point we chose was below the line, so that means that we must need to shade above the line instead. . This is a false, statement, and the point we chose was below the line, so that means that we must need to shade above the line instead.
Lastly, since we are dealing with greater than or equal to, we keep the line solid, but if we were dealing with just greater than, you would dash the line.
|
|
|