Question 169654: 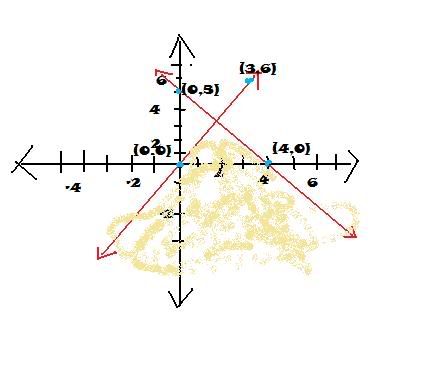
my question is :
a student graphed a system of inequalities, shading only the region containong the solutions of the sytem. Write a system of inequalities corresponding to the students graph. Explain how you arrived at your answer.
there is no isbn because this is a module book question
Answer by jim_thompson5910(35256)   (Show Source): (Show Source):
You can put this solution on YOUR website! There are two lines graphed, so we need to find the equations of those two lines first. From there, we can find the inequalities.
Line 1: Line going through points (0,4) and (4,0)
So let's find the equation of line 1
First let's find the slope of the line through the points ) and and )
 Start with the slope formula. Start with the slope formula.
 Plug in Plug in  , ,  , ,  , and , and 
 Subtract Subtract  from from  to get to get 
 Subtract from to get Subtract from to get
 Reduce Reduce
So the slope of the line that goes through the points and is
Now let's use the point slope formula:
 Start with the point slope formula Start with the point slope formula
 Plug in , , and Plug in , , and
 Distribute Distribute
 Multiply Multiply
 Add 4 to both sides. Add 4 to both sides.
 Combine like terms. Combine like terms.
 Simplify Simplify
So the equation that goes through the points and is
-------------------------------------------------------
Line 2: Line through the points (0,0) and (3,6)
So let's find the equation of line 2
First let's find the slope of the line through the points ) and and )
Start with the slope formula.
 Plug in Plug in  , ,  , ,  , and , and
 Subtract from Subtract from  to get to get
 Subtract from Subtract from  to get to get
 Reduce Reduce
So the slope of the line that goes through the points and is
Now let's use the point slope formula:
Start with the point slope formula
 Plug in , , and Plug in , , and
 Distribute Distribute
 Multiply Multiply
 Add 0 to both sides. Add 0 to both sides.
 Combine like terms. Combine like terms.
 Remove the trailing zero Remove the trailing zero
Simplify
So the equation that goes through the points and is
===================================================
So the system of equations(we'll convert them into inequalities later) is:

Now, notice how the shaded region is BELOW both of the lines. In other words, EVERY point in the shaded region has a y-coordinate that is less than a point on either line.
So this means that we can take and convert it to  (since every point in this shaded region is below the line ) and we can take and convert it to (since every point in this shaded region is below the line ) and we can take and convert it to  (since every point in this shaded region is below the line ) (since every point in this shaded region is below the line )
So we then end up with the system of inequalities

Note: If you are INCLUDING the boundaries, then you need to change the inequality signs from  to to  like this: like this:

|
|
|
