Question 169409: how would you graph and describe the solution x > -y?
Answer by gonzo(654)   (Show Source): (Show Source):
You can put this solution on YOUR website! -----
please note:
in interval notation,
(a means x is > a
[a means x is >= a
b) means x is < b
b] means x is <= b
(a,b) means a < x < b
[a,b] means a <= x <= b
-----
please note:
in interval line,
-------------------- represent part of line that is not in the interval.
==================== represent part of line that is in the interval.
the (, [, ), ] mean the same as above.
-----
equation you have is x > -y
-----
in interval notation, this would be:
(-y, ) )
on the interval line, this would look like:
<-------------------(-y ========================= )----------->
i can't actually graph this in its present form, but if we massage the equation then we can graph it.
your equation is x > -y which is the same as -y < x
if we multiply both sides of the equation by -1, we get
y > -x
because multiplying both sides of an inequality by a negative number reverses the inequality.
now the equation is in a form that can be graphed.
in order to draw the graph, make y = -x
that would be the equation of the line that would be the dividing point.
the graph would look like the following:
look below the graph for further comments.
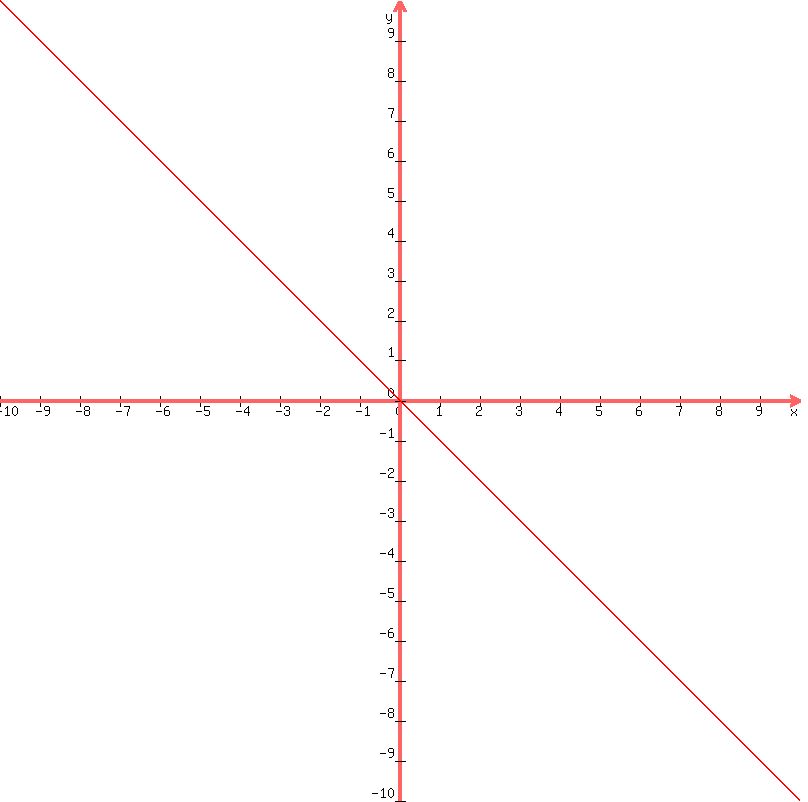
since your equation is y > -x, the area over the line would be the area that satisfies the equation.
for any given value of x, any value of y greater than -x would satisfy the inequality.
for example:
let x = 5.
looking at x = 5, the line shows y = -5.
any value of y greater than -5 would satisfy the inequality at that point.
if you were drawing the graph, you would shade the area over the line of y = -x to show that is the area that satisfies the equation y > -x.
-----
|
|
|