Question 16780: How do I graph an equation with two variables.  y=x+2 y=-x+2 y=x+2 y=-x+2
Answer by rapaljer(4671)   (Show Source): (Show Source):
You can put this solution on YOUR website! There will be graphs, since you have two equations, and these will both be straight lines.
General explanation of y =mx+b. The y-intercept of a graph is the point where x=0. In the general equation y=mx+b, when x=0, the y-intercept is the constant coefficient (that it, the number term of the equation.) The steepness or slope of the line is the coefficient of x, which in this case is m. The slope is actually the rise over the run, the vertical distance divided by the horizontal distance from one point to another point on the line. With these two (the Y-intercept and the slope!) it is really easy to draw a graph.
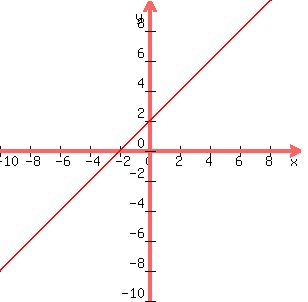
y=1*x+2
The y-intercept is the number term which is 2, and the slope is the coefficient of x, which is 1.
To draw the graph, go up two units on the y axis and put a point. Then, because the slope is 1, which means 1 over 1, with your pencil on this point go up another 1 and go right 1 and put another point. Connect these two points, and it should look like this:
y=-1*x+2
The y-intercept is the number term which is 2, and the slope is the coefficient of x, which is -1.
To draw the graph, go up two units on the y axis and put a point. Then, because the slope is -1, which means -1 over 1, with your pencil on this point go down 1 and go right 1 and put another point. Connect these two points, and it should look like this:

R^2 at SCC
|
|
|