Question 140871: Can someone please help me with this two part problem?
Create a table and plot the graph for each of the following polynomial expressions.
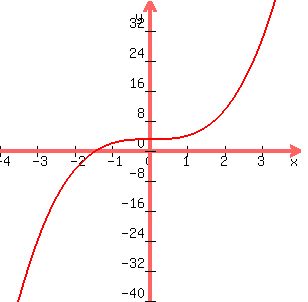
a. y=x^3+3 The x values are 0, 1, -1, 2, -2, 3, and -3.
b. y=x^4-4 The x values are the same as part a.
I am confused about what to do with this problem any help would be great.
Found 2 solutions by Fombitz, solver91311:
Answer by Fombitz(32388)   (Show Source): (Show Source):
You can put this solution on YOUR website! 
Plug in x values and calculate y values.


Now you have your table of ordered pairs (x,y).
(-3,-24)
(-2,-5)
(-1,2)
(0,3)
(1,4)
(2,11)
(3,30)
Plot these values.
Similarly,

Plug in x values and calculate y values.


Now you have your table of ordered pairs (x,y).
(-3,84)
(-2,19)
(-1,4)
(0,3)
(1,4)
(2,19)
(3,84)
Plot these values.

Answer by solver91311(24713)  (Show Source): (Show Source):
You can put this solution on YOUR website! Make a little table with two columns. Put x at the top of the first column, and y at the top of the other column. Write the given x values in a column underneath the x -- best if you put them in ascending order first, starting with -3. Then, for each one of the x-values, substitute that value into the equation and do the arithmetic to calculate the value of y. Enter that value in the y column of your table next to the value of x that you just used.
From each row of the table you just created you can create one ordered pair that corresponds to a point on the graph of the equation.
Your 1st value is -3, so , so  . That means your first ordered pair is (-3,24). Do this same process for the rest of the given x-values, then plot all of the points. When you are done, draw a smooth curve through the points. . That means your first ordered pair is (-3,24). Do this same process for the rest of the given x-values, then plot all of the points. When you are done, draw a smooth curve through the points.
|
|
|