|
Question 125588: Sketch the graph of the inequality y<-2x
Found 2 solutions by solver91311, SoOoDumb:
Answer by solver91311(24713)   (Show Source): (Show Source):
You can put this solution on YOUR website! To graph an inequality, you need to find a line and then shade in the appropriate half-plane.
The line is found by replacing the inequality symbol with an equals sign and graphing the resulting line. If you have 'or equals' in your inequality sign in the first place, then you will draw a solid line, otherwise draw a dashed line.
Once you have your line, you need to know which side of the line to shade. Pick a point that is not on the line. If it isn't on the line I usually pick (0,0) because the arithmetic is easy, but if the line passes through the origin, pick something different, like (1,1).
Substitute the x- and y-coordinates from the point you selected into your original inequality. If the substitution results in a true statement, you have found the 'correct' side of the line. Shade in that side. On the other hand, if you get a false result, shade in the other side.
Here's a graph of the line 

On your graph, you should make this a dashed line because 'or equal to' is not part of your original inequality. Note that the point (1,1) is below and to the right of the line.
Substitute 1 for x and 1 for y in your inequality:  . This is a true statement, so below right is the side to shade. . This is a true statement, so below right is the side to shade.
Had you chosen a point like (-1,0) (up left of the line) to test you would have gotten the false statement  . .
Answer by SoOoDumb(14) (Show Source): (Show Source):
You can put this solution on YOUR website! 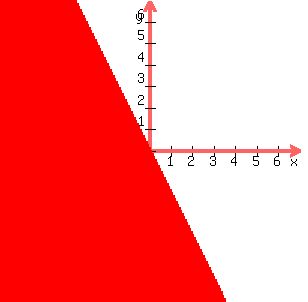
Because the inequality is in y-intercept form (y=mx+b) the b = the y-intercept point. There isn't a b in this inequality so it is 0. The line goes downward because the leading coeficient (-2x) is negative. The slope is -2/1. Rise over run. Go down two and over one to find the next point and you can graph your line. To find weather to shade above the line or below, you pick any point and plug it into the equation or inequality. I will pick a point above the line. (3,4)
4<-2(3)
4<-6 that point doesn't solve the inequality. So lets pick a point below the line. (-3,-4)
-4<-2(-3)
-4<6 this is correct so we know that the solution region is below the line. Therfore, you shade down.
|
|
|
| |