Question 125280: I need your help on how to graph this equation,here is the question along with the equation.
Questions : Graph the function. Compare the graph with the graph of f(x)=x
Equation : g(x)=x+5
Please explain to me how to graph the equation, I'm confuse! Thanks
Answer by Earlsdon(6294)   (Show Source): (Show Source):
You can put this solution on YOUR website! To graph an equation that is given to you in "function" form, as in your problem, replace the f(x) and g(x) with y, as follows:
f(x) = x change to:
y = x
g(x) = x+5 change to:
y = x+5
Now since these are both "linear" functions, you need at most two points to define the line represented by them.
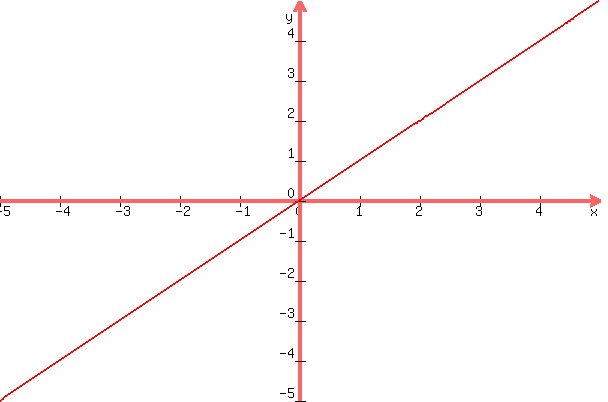
For the first one, y = x, you can let x = 1, then y = 1, and x = 0, then y = 0.
So here are two points (1, 1) and (0, 0) that you can plot on you coordinate graph paper, after drawing the x- and y-axes. Now join the two points with a straight line and you have the graph of y = x or f(x) = x.
Here's what it should look like:
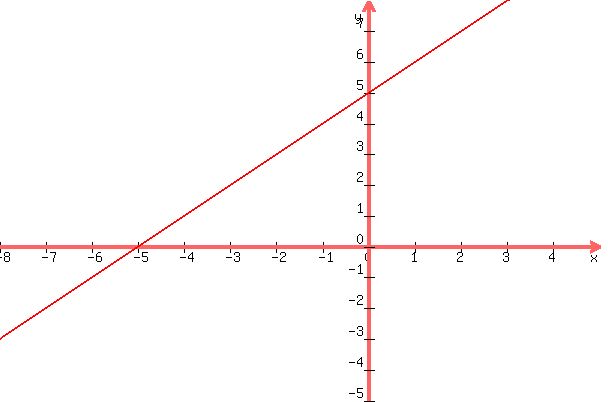
For the second one, y = x+5, you do the same thing. Let x = 1 then y = 6 and let x = 0 then y = 5. Here are the two points that you can plot on your coordinate graph paper (0, 5) and (1, 6).
Here's what you should get:
|
|
|