Question 122430: For a 2-day rental, a rental car agency charges a $40 fee per day plus $0.35 per mile.
The equation represents this model, where C symbolizes the total cost of
the rental, and x stands for the number of miles driven.
A. Find the y-intercept of this graph and explain what it means in the context of the problem. Show all work to receive full credit.
B. Explain the slope of the line within the context of this problem.
C. Graph the equation.
Answer by bucky(2189)   (Show Source): (Show Source):
You can put this solution on YOUR website! The problem establishes that you are going to rent a car for 2 days.
.
Ask yourself how you would compute the cost of that rental. The problem tells you that you
will pay $40 per day, and this means that for a two-day rental you will pay $80.
.
But you will also have to pay $0.35 per mile for each mile that you drive. If you drive zero
miles you will have to pay the $80. However, if you drive 10 miles, you will not only have
to pay the $80, you will also have to pay $0.35 times 10 which equals $3.50. So your total
cost for the two-day rental with 10 miles driven is $80 + $3.50 = $83.50
.
What if you drive 100 miles over the two days. You would owe the rental company $80 plus
$0.35 times 100 which is $35.00. So your total bill would be $115.00 for the two days.
.
If you establish that your graph has the number of miles driven as the horizontal
axis and the total cost of the rental as the vertical axis, you then have three points you can
plot. Those points are (0,80) and (10, 83.50) and (100, 115). These are the points that
you figured out above.
.
The form of the equation we can write to describe this graph is the slope-intercept
form. The slope-intercept form is (in this case C is the y-axis value):
.
C = mx + b
.
where m is the slope of the graph and b is the value on the vertical axis where the graph
crosses the vertical axis.
.
For your problem b is the fixed cost of $80. When x equals 0 miles, b the cost was $80
so the intercept on the Cost (or vertical axis) is $80.
.
The slope, m, is 0.35 because each time x gets bigger by 1 unit, the Cost goes up by $0.35 units.
.
So the cost equation that you are graphing is:
.
C = 0.35x + 80
.
If you just plug in the value of x (which is the number of miles driven) you get the total
cost of the rental ... or C. Drive 500 miles and the cost is:
.
C = 0.35*500 + 80 = 175 + 80 = 255
.
So for a two day rental with 500 miles driven, the cost would be $255 and on the graph this
would plot as the point (500, 255).
.
Your graph should look something like this:
.
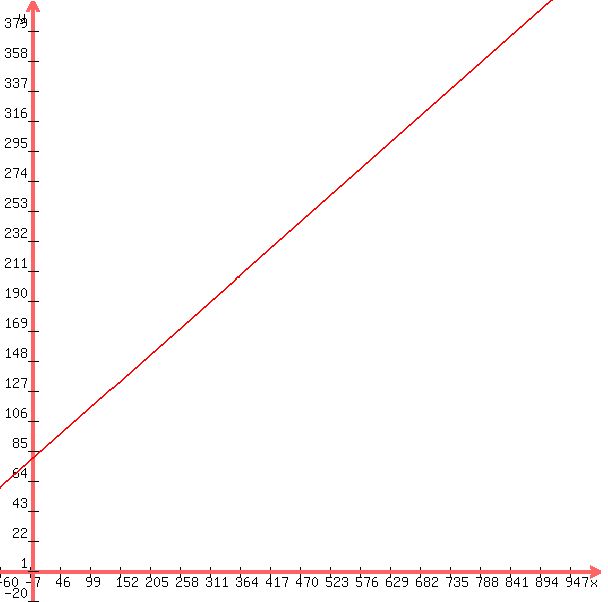
.
Notice that it crosses the vertical axis at +80. And the slope is 0.35. When you graph it,
you will want to choose some better values along the x-axis and y-axis ... not all the
"un-nice" values shown on the above graph. Maybe make the x-axis in terms like 100, 200, 300, and so
on, and the y-axis (for Cost) in terms of 50, 100, 150, 200, and so on. Something that
is a little easier to read than the graph shown above.
.
Hope this helps you to understand the problem a little better.
.
|
|
|