Question 1205511: If you solve the question below, I'll be appreciated.
The scores of students on the SAT college entrance examinations at a certain high school had a normal distribution with mean \mu = 548.7 and standard deviation \sigma = 25.9.
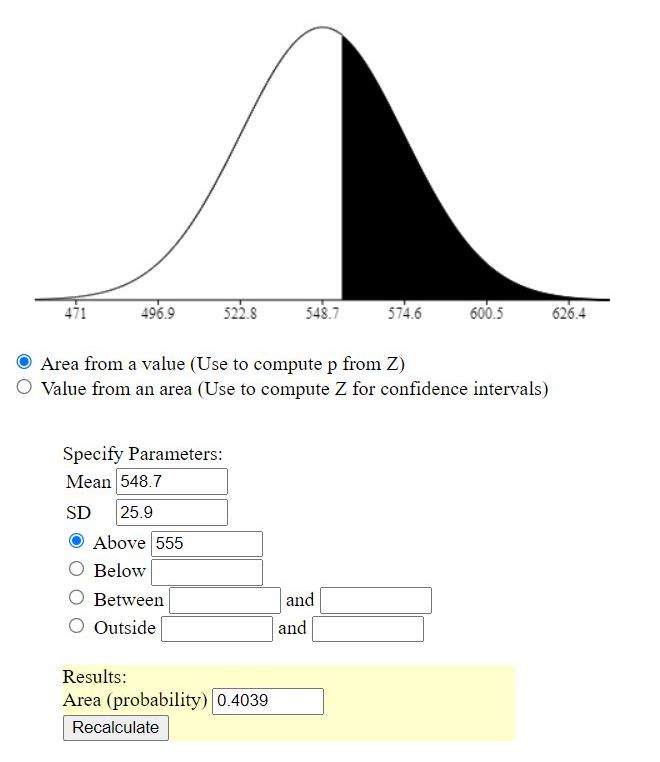
(a) What is the probability that a single student randomly chosen from all those taking the test scores 555 or higher?
ANSWER: ?
For parts (b) through (d), consider a simple random sample (SRS) of 35 students who took the test.
(b) What are the mean and standard deviation of the sample mean score \bar x, of 35 students?
The mean of the sampling distribution for \bar x is: ?
The standard deviation of the sampling distribution for \bar x is: ?
(c) What z-score corresponds to the mean score \bar x of 555?
ANSWER: ?
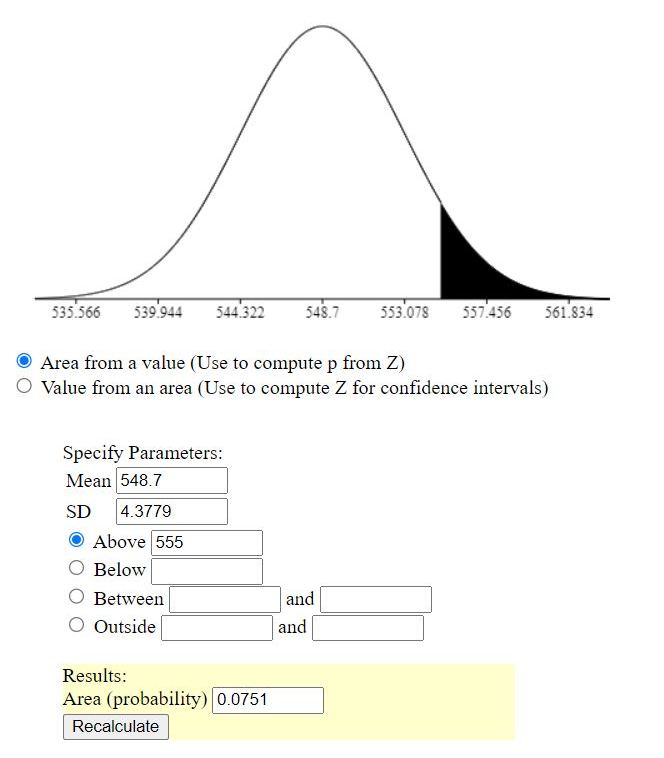
(d) What is the probability that the mean score \bar x of these students is 555 or higher?
ANSWER: ?
Answer by Theo(13342)   (Show Source): (Show Source):
You can put this solution on YOUR website! The scores of students on the SAT college entrance examinations at a certain high school had a normal distribution with mean \mu = 548.7 and standard deviation \sigma = 25.9.
(a) What is the probability that a single student randomly chosen from all those taking the test scores 555 or higher?
the probability is .4039.
For parts (b) through (d), consider a simple random sample (SRS) of 35 students who took the test.
sample size is 35.
standard error = standard deviation / sqrt(sample size) = 25.9/sqrt(35) = 4.3779 rounded to 4 decimal places.
(b) What are the mean and standard deviation of the sample mean score \bar x, of 35 students?
standard error of the sample is equal to 4.3779.
if the standard deviation is taken from the population, the z-score is used.
if the standard deviation is taken from the sample, the t-score is used.
the mean of the sample is not known at this time, but is assumed to converge to the population mean when multiple sample of the same size are extracted from the population.
the confidence interval limits are established as the time of the test.
if within those limits, the sample mean is assumed to be the same as the population mean, with the only difference due to random variations expected of different samples of the same size being drawn from the same population.
if not within those limits, the sample mean is assumed to be different from the population mean, with the difference not being due to random variations expected of different samples of the same size being drawn from the same population.
the short answer is that the average of numerous sample means taken from samples of the same size is expected to eventually be equal to the population mean.
(c) What z-score corresponds to the mean score \bar x of 555?
z = (x-m)/s
z is the z=score
x is the sample mean of 555.
m is the assumed population mean of 548.7
s is the standard error of 4.3779 rounded to 4 decimal places.
z = (555 - 548.7) / 4.3779 = 1.439 rounded to 3 decimal places.
(d) What is the probability that the mean score \bar x of these students is 555 or higher?
probability of getting a z-score higher than that is equal to .0751 rounded to 4 decimal places.
when you're looking for the probability of a single element, use the standard deviation.
when you're looking for the probability of the mean of a sample, use the standard error.
here's a reference.
https://365datascience.com/tutorials/statistics-tutorials/central-limit-theorem/
|
|
|