SOLUTION: Q1
a) The amount of water consumed each day by a healthy adult follows a normal distribution with a mean of 1.4 liters. A health campaign promotes the consumption of at least 2.0
Algebra ->
Probability-and-statistics
-> SOLUTION: Q1
a) The amount of water consumed each day by a healthy adult follows a normal distribution with a mean of 1.4 liters. A health campaign promotes the consumption of at least 2.0
Log On
Question 1205362: Q1
a) The amount of water consumed each day by a healthy adult follows a normal distribution with a mean of 1.4 liters. A health campaign promotes the consumption of at least 2.0 liters per day. A sample of 10 adults after the campaign shows the following consumption in liters:
1.5 1.6 1.5 1.4 1.9 1.4 1.3 1.9 1.8 1.7
At the .01 significance level, can we conclude that water consumption has increased? Calculate and interpret the p-value.
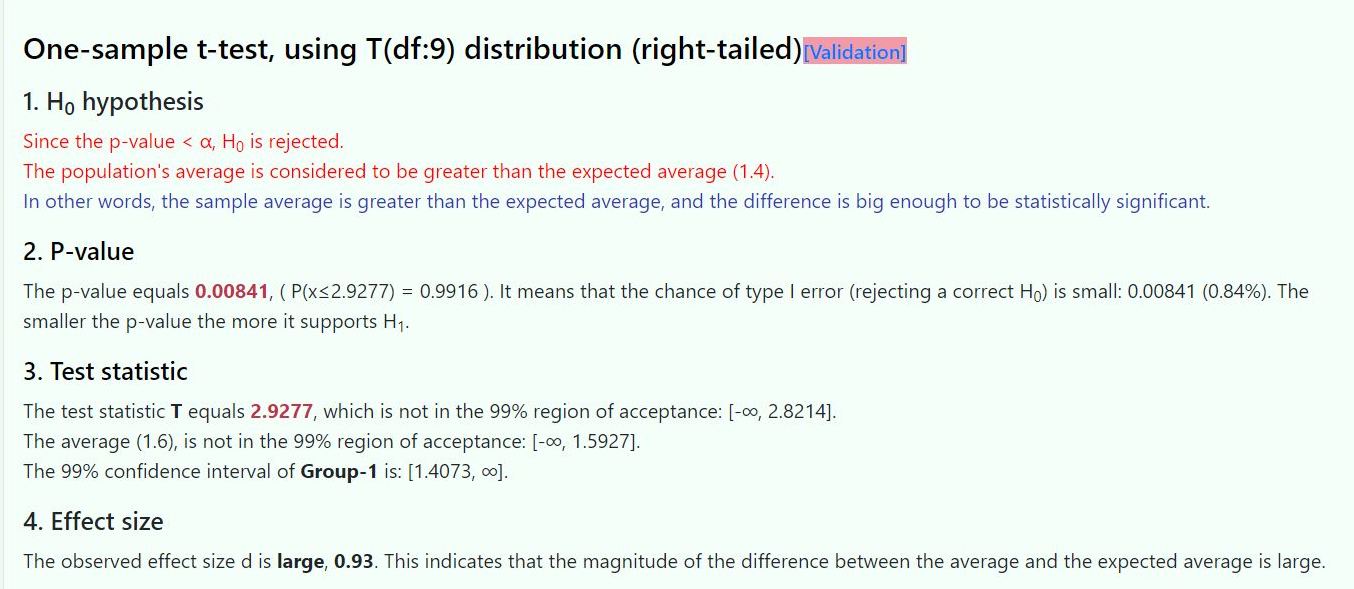
the test was a one tail test at the high end of the 99% confidence interval.
it was a one tail test because the test was to determine if the sample mean was greater than the population mean at the .01 level of significance.
here are the results of the test.
degrees of freedom for the t-test was 9 (1 less than the sample size of 10).
the test t-score was 2.9277 which was greater than the critical t-score of 2.8214.
the test p-value was .00841 which was less than the critical p-value of .01.
because the results of the test were considered significant, it was concluded that the mean value of water consumption has increased after the health campaign promoted the consumption of at least 2 liters of water per day.