SOLUTION: The R.R Bowker Company collects information on the retail prices of books and publishes its findings in The Bowker Annual Library and Book Trade Almanac. In 2005, the mean retail p
Algebra ->
Probability-and-statistics
-> SOLUTION: The R.R Bowker Company collects information on the retail prices of books and publishes its findings in The Bowker Annual Library and Book Trade Almanac. In 2005, the mean retail p
Log On
Question 1205339: The R.R Bowker Company collects information on the retail prices of books and publishes its findings in The Bowker Annual Library and Book Trade Almanac. In 2005, the mean retail price of all history books was $78.01. this year’s retail prices for 40 randomly selected history books are shown in the table below.
82.55 74.43 73.58 77.50 74.25 77.45 83.99 69.26
72.80 81.37 89.23 77.83 82.71 90.29 80.64 80.31
73.89 82.28 74.35 77.49 78.88 79.42 101.92 98.72
80.54 77.55 77.44 87.25 78.25 67.63 83.03 87.81
80.26 88.25 78.91 98.93 80.35 91.48 95.59 69.20
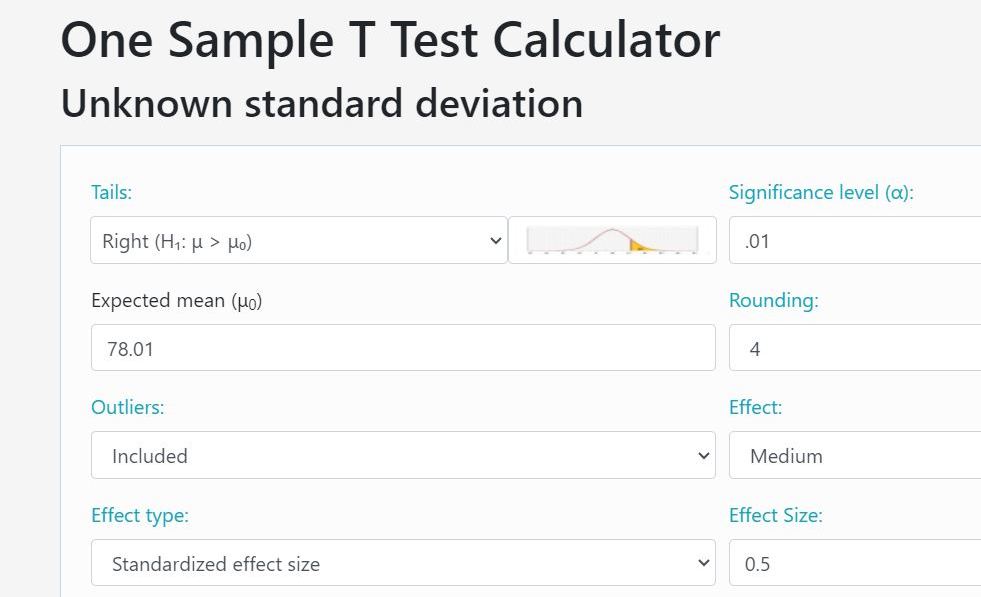
At the 1% significance level, do the data provide sufficient evidence to conclude that this year’s mean retail price of all history books has increased from the 2005 mean of $78.01? Assume that the population standard deviation of prices for this year’s history books is $7.61.
A. State null hypothesis.
B. State alternative hypothesis
C. Level of significance
D. Test statistic E. Decision rule based on p-value F. Statistical decision
G. Conclusion Answer by Theo(13342) (Show Source):
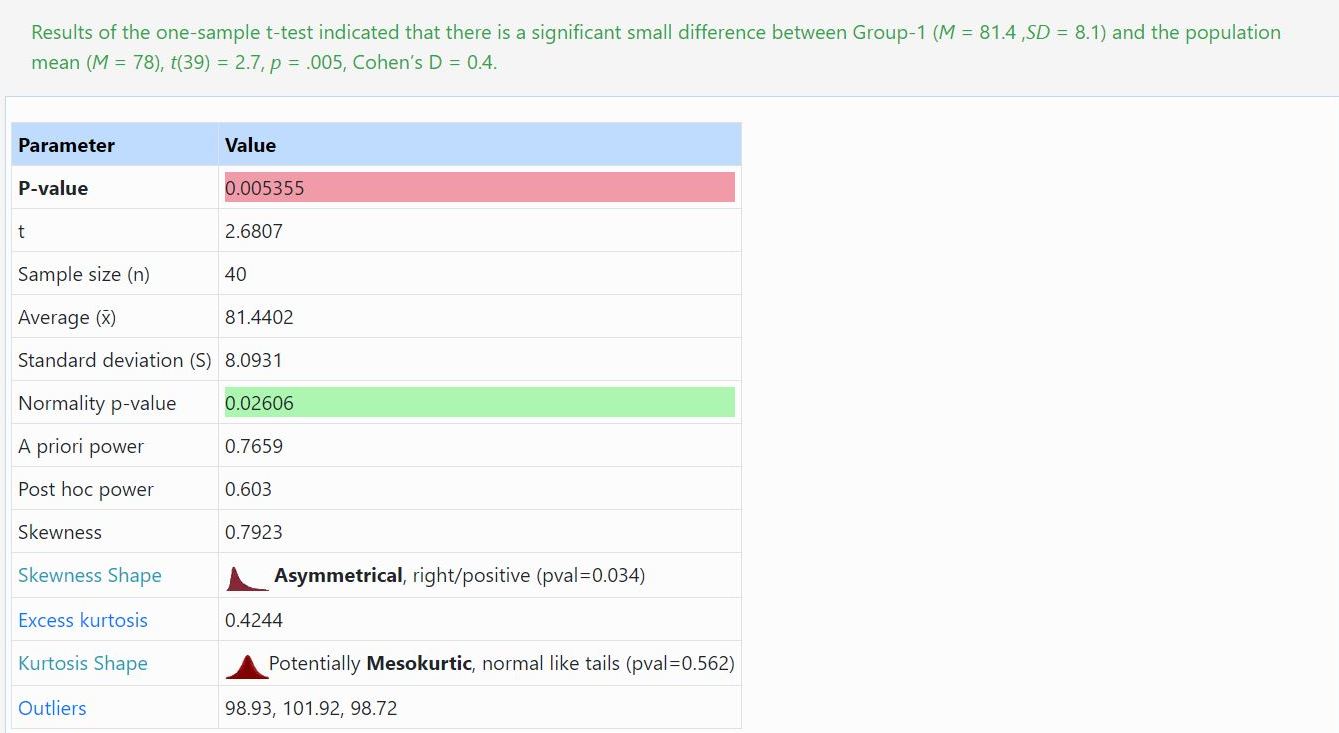
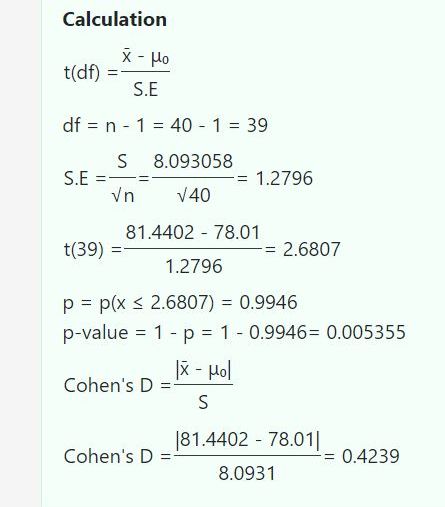
population mean was 78.01
the sample mean was 81.4402
the sample standard deviation was 8.093058
the sample size was 40
the sample degrees of freedom was 39
the standard error was equal to the standard deviation / sqrt(sample size = 8.093058 / sqrt(40) = 1.2796
the test t-score was 2.6807
the test p-value was .005355
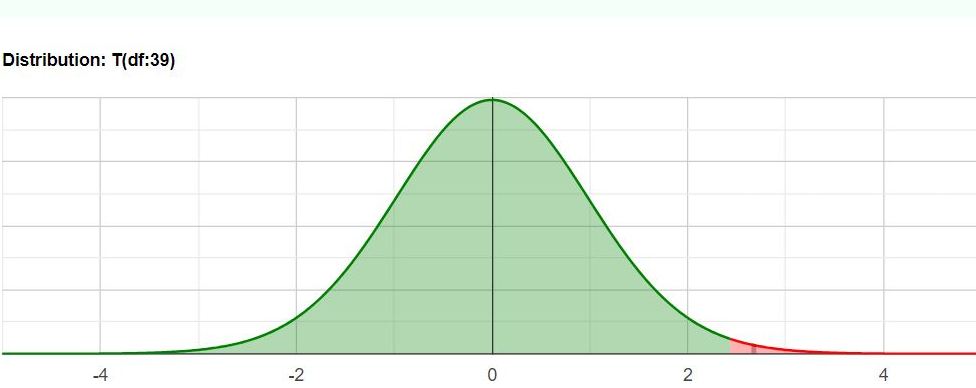
the critical t-score at 99% right tail confidence interval was 2.4258.
the critical p-value was .01
the test t-score was greater than the critical t-score and the test p-value was less than the critical p-value.
this indicated that the difference between the sample mean and the population mean was significant, leading to the conclusion that this year's mean price of books had increased from the mean price in 2005.
the red part of the graph showed the tail on the right end of the confidence interval. that's the area to the right of the distribution graph that is not part of the confidence interval.