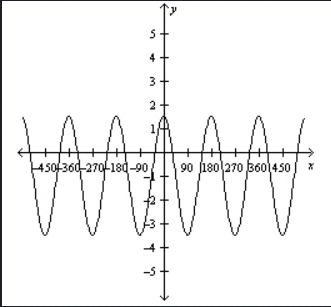
Question 1202196: Determine the equation of a cosine function for the following graph of a sinusoidal function:
https://gyazo.com/80871eaf3fe6163e135f3fbce5538d74
Found 2 solutions by ikleyn, math_tutor2020:
Answer by ikleyn(52824)   (Show Source): (Show Source):
Answer by math_tutor2020(3817)  (Show Source): (Show Source):
You can put this solution on YOUR website!
Answer: y = 2.5*cos(2x)-1
This is when you are in degree mode.
=============================================================================
Explanation:
The image from the question is this
The template for cosine is
y = A*cos(B(x-C))+D
The variables are:
|A| = amplitude
B = helps determine the period, more on that later
C = phase shift, which is the side to side shift
D = up and down shift, useful to determine midline
The goal is to determine the values of A, B, C, and D.
-----------------------------
Let's start with A.
The amplitude is half of the height of the sine wave.
The peak occurs when y = 1.5 and the valley is when y = -3.5; these represent the largest and smallest possible y values respectively.
Subtract and use absolute value to find the vertical distance between peak and valley.
|peak - valley| = |1.5 - (-3.5)|
|peak - valley| = |1.5 + 3.5|
|peak - valley| = |5|
|peak - valley| = 5
Or you could say
|valley - peak| = |-3.5 - 1.5|
|valley - peak| = |-5|
|valley - peak| = 5
The vertical distance from peak to valley is 5 units.
Half of this is 5/2 = 2.5 and it is the amplitude.
|A| = 2.5 leads to either A = 2.5 or A = -2.5
We use A = 2.5 because the cosine graph is above the x axis when x = 0.
-----------------------------
Now onto the variable B.
This variable is tied to the period.
The period is the length of each cycle, aka wavelength.
One peak occurs at x = 0
The next neighboring peak to the right is when x = 180
This is a gap of 180-0 = 180 units
The period is 180 because the curve repeats itself every 180 units.
T = 180 = period
B = 2pi/T
B = 2pi/180
B = pi/90
That would be the value of B if we are in radian mode.
However, the next set of steps show a much nicer result for B when in degree mode.
B = 360/T
B = 360/180
B = 2
Because the x axis shows 90,180,270,etc it appears your teacher might want degree mode.
-----------------------------
The phase shift is C = 0 because cosine has x = 0 lead to a peak. We haven't shifted the peak left or right off the y axis.
I recommend using a graphing tool like Desmos to look at y = cos(x) to see what I mean.
GeoGebra is another handy graphing tool I use all the time.
-----------------------------
The midline is y = D to represent the horizontal line cutting through the middle of this cosine curve.
Apply the midpoint of the peak and valley
(peak+valley)/2 = (1.5+(-3.5))/2 = -2/2 = -1
The midline is y = -1 and we get D = -1
-----------------------------
Summary
A = 2.5
B = 2 (when in degree mode)
C = 0
D = -1
Then
y = A*cos(B(x-C))+D
y = 2.5*cos(2(x-0))+(-1)
y = 2.5*cos(2x)-1
This is when your calculator is in degree mode.
Graph using Desmos
https://www.desmos.com/calculator/ju2jkpfbkq
|
|
|