Question 1200018: The average sales price of a single-family house in the United States is $290,600. You randomly select 12 single-family houses. What is the probability that the mean sales price is more than $265,000? Assume that the sales prices are normally distributed with a standard deviation of $36,000. (Adapted from The U.S. Commerce Department) a. Use the Central Limit Theorem to find and and sketch the sampling distribution of the sample means. b. Find the z-score that corresponds to $265,000. c. Find the cumulative area that corresponds to the z-score and calculate the probability. d. Interpret the results.
Answer by Theo(13342)   (Show Source): (Show Source):
You can put this solution on YOUR website! the mean is 290,600
the standard deviation is 36,000
sample size is 12.
standard error is equal to standard deviation divided by square root of sample size = 36,000 / sqrt(12)
z-score formula is z = (x - m) / s
z is the z-scoe
x is the raw score
m is the mean
s is the standard error
when x = 265,000, the formula becomes:
z = (265,000 - 290,000) / (36,000 / sqrt(12)).
solve for z to get:
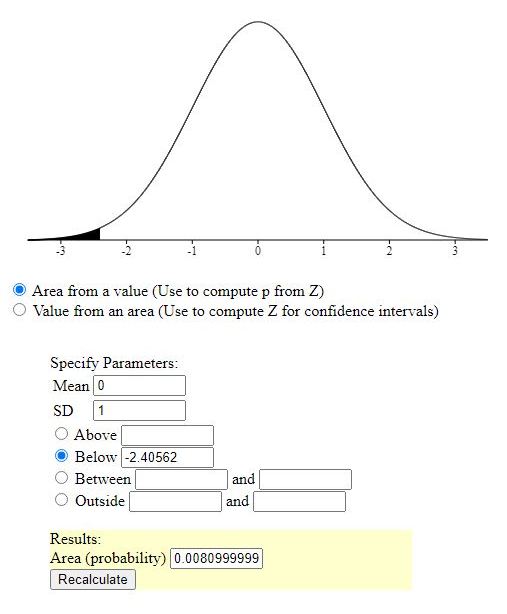
z = -2.405626122
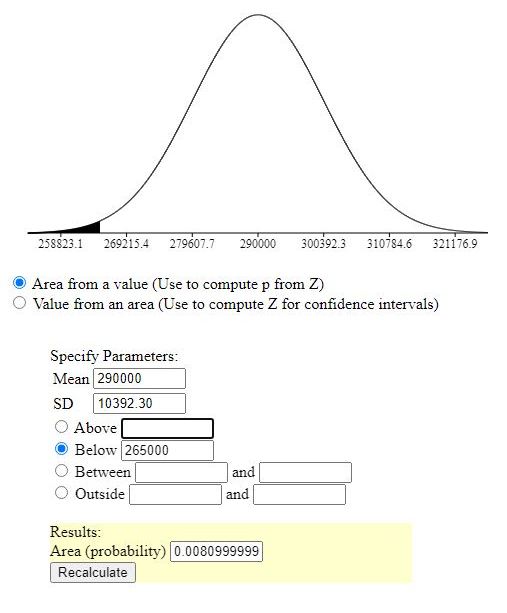
area to the left of that z-score = .0080723832
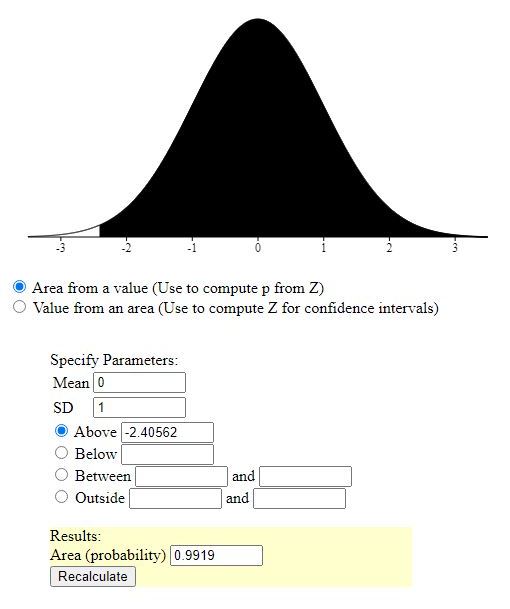
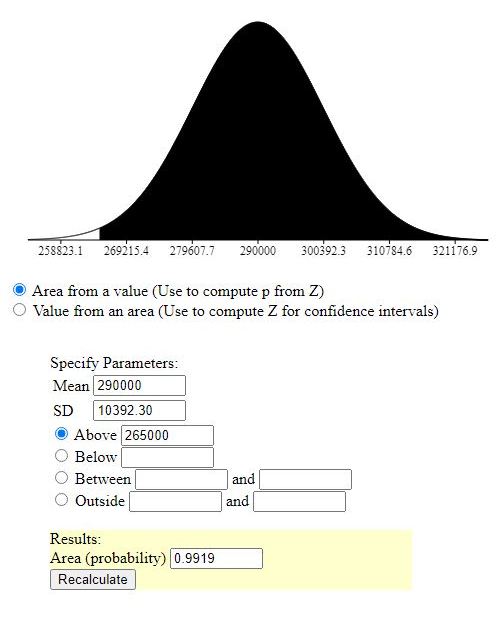
area to the right of that z-score = 1 minus that = .9919276168
this tells you that the probability of getting a sample of 12 houses where the mean price is less than 265,000 is equal to .0080723832 and the probability of getting a sample of 12 house where the mean price is greater than 265,000 is equal to .9919276168
if you were to sketch the graph of the normal probability curve, you would get:
with z-scores:
with raw scores:
when you're working with z-scores, the meanis 0 and the standard deviation is 1.
then you're working with raw scores, the mean is the population mean and the standard deviation is the standard error.
with sample means, you use the standad error which is the standard deviation divided by the square root of the sample size.
with z-scores, the area to the left of the z-score is the probability you will find a z-score less than the specified z-score and the area to the right of the z-score is the probability you will find a z-score more than the specified z-score.
with raw scores, the area to the left of the raw score is the probability yu will find a raw score less than the specified raw score and the area to the right of the raw score is the probability you will find a raw score more than the specified raw score.
the calculator is capable of doing it either way.
the calculator can be found at https://davidmlane.com/hyperstat/z_table.html
|
|
|