|
Question 1198986: Graph the solution to the system of inequalities given below:
x≤2
y>−2x+2
Found 3 solutions by Theo, ikleyn, math_tutor2020:
Answer by Theo(13342)   (Show Source): (Show Source):
You can put this solution on YOUR website! using the desmos.com calcullator, you would graph the oppositve of the inequalities.
the area on the graph that is not shaded is your region of feasibility.
the graph is shown below:
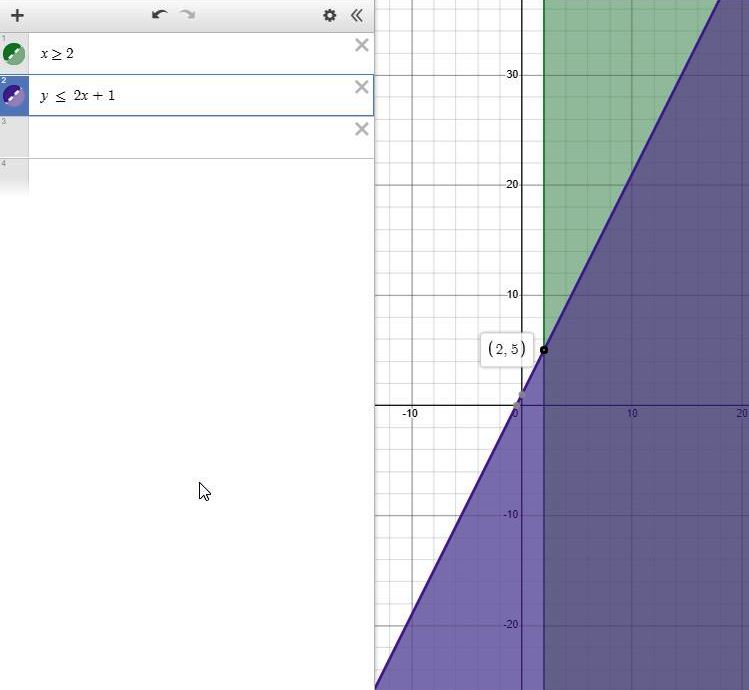
as can be ween on the graph, the region of feasibility is where x <== 2 and where y >= 2x+2
any point that satisfies those two inequalities will be in the region of feasibility.
for example:
the point (4,20) will not satisfy those inequalities because x >= 2.
on the graph, it is in the shaded region.
the point (-10,-20) will not satisfy those inequalities because it is not equal o or above the line of the equation y = 2x + 2.
when x = -10, y = 2x + 2 becomes y = -18.
y = -20 is not above or equal to -18.
that point is in the shaded region as shown on the graph.
the point (-10,10) is in the feasible rregion and is not shaded.
y = 2x + 2 = -18 is on the line when x = -10.
y = 10 is above the line at that point when x = -10.
Answer by ikleyn(52787)  (Show Source): (Show Source):
You can put this solution on YOUR website! .
Graph the solution to the system of inequalities given below:
x ≤ 2
y > −2x+2
~~~~~~~~~~~~~~~~~
The plot in the post by @Theo is INCORRECT.
I came to bring you a correct solution.
They want you solve this system of two inequalities

   x <= 2          (1)

   y > -2x+2       (2)

by graphing.


So, plot two straight lines in a coordinate plane

    x = 2           (1')

    y = -2x+2       (2')


      Plot x = 2 (red)  and  y = -2x+2 (green)


Notice that the line x = 2 (red) is vertical line, parallel to y-axis.


The solution set to the given inequalities are the points of the coordinate plane,

    that are, at the same time,  on the left of the red line  AND  above the green line.


These points are inside one of the four angles, formed by the two lines, where you see the words "the solution set".


The points of the red   line above the intersection point are included to the solution set.

The points of the green line are  NOT INCLUDED  to the solution set.

The intersection point  DOES NOT BELONG  to the solution set.
Plot x = 2 (red) and y = -2x+2 (green)
Notice that the line x = 2 (red) is vertical line, parallel to y-axis.
The solution set to the given inequalities are the points of the coordinate plane,
that are, at the same time, on the left of the red line AND above the green line.
These points are inside one of the four angles, formed by the two lines, where you see the words "the solution set".
The points of the red line above the intersection point are included to the solution set.
The points of the green line are NOT INCLUDED to the solution set.
The intersection point DOES NOT BELONG to the solution set.
Solved.
------------------
On solving inequalities in two variables graphically, look into the lesson
- Solving systems of inequalities in two unknown graphically in a coordinate plane
in this site.
Learn the method from there.
Happy learning (!)
Answer by math_tutor2020(3817)  (Show Source): (Show Source):
You can put this solution on YOUR website!
The tutor @Theo should have plotted y ≤ -2x+2 instead of y ≤ 2x+1
Keep in mind that his shaded regions are the opposite of what you are given, which means the unshaded white region is the final solution set. This is if we follow the method @Theo set out. This method is nice because it avoids looking at overlapping regions.
The alternative way is to graph x≤2 which has its shaded region to the left of the vertical line x = 2. The boundary is a solid line.
Overlap that with the shaded region of y > −2x+2, which has its shaded region above the dashed boundary line. These regions overlap to get what was mentioned in the previous paragraph, and what is shown below.
This is what the final graph should look like when shading just the solution set

Points in the blue shaded region satisfy both original inequalities.
We are to the left of x = 2, and above y = -2x+2
Points on the dashed line are not part of the solution set. This means the point (2,-2) isn't in the solution set.
Points on the solid boundary line, adjacent to the blue interior region, are part of the solution set.
|
|
|
| |