Question 1188535: The following are data for 12 individual’s daily sodium intake and their systolic blood pressure readings.
Person
1
2
3
4
5
6
7
8
9
10
11
12
Sodium
6.8
7.0
6.9
7.2
7.3
7.0
7.0
7.5
7.3
7.1
6.5
6.4
BP
154
167
162
175
190
158
166
195
189
A researcher investigator is interested in learning how strong the association is between these variables and how well we can predict blood pressure from sodium intake.
a.Calculate the value of r and the regression equation for the data.
b.Test the hypothesis at 0.05 level of significance.
c.What would be a likely blood pressure for a person with sodium of 6.3? How about sodium of 7.6?
Answer by Theo(13342)   (Show Source): (Show Source):
You can put this solution on YOUR website! unfortunately, you don't have 12 blood pressure readings.
you only have 9.
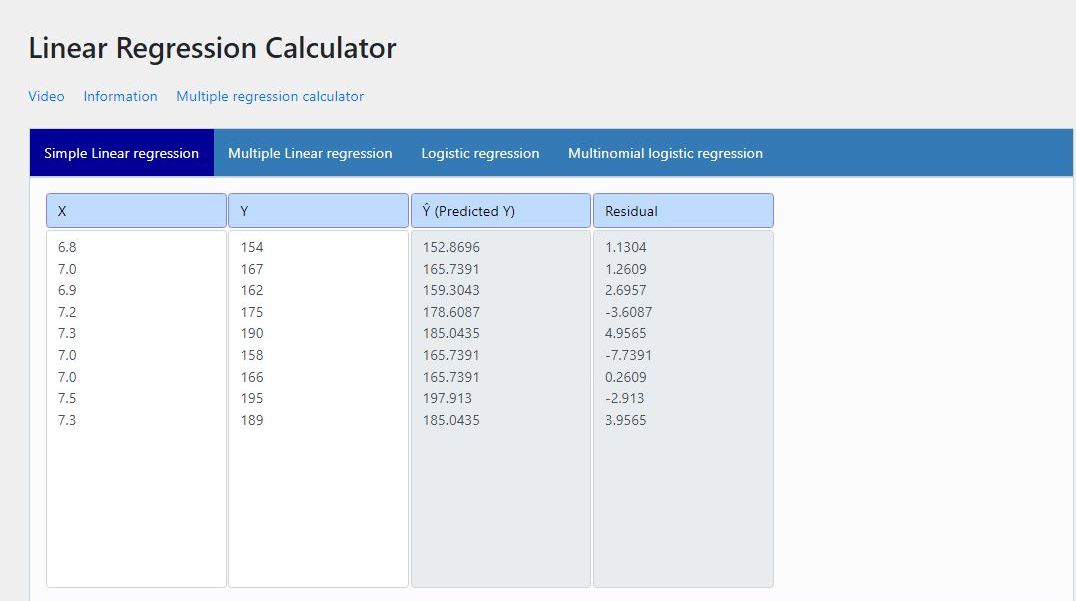
i did an analysis with the first 9 pairs, using the regression tool at https://www.statskingdom.com/linear-regression-calculator.html
the results are shown below:
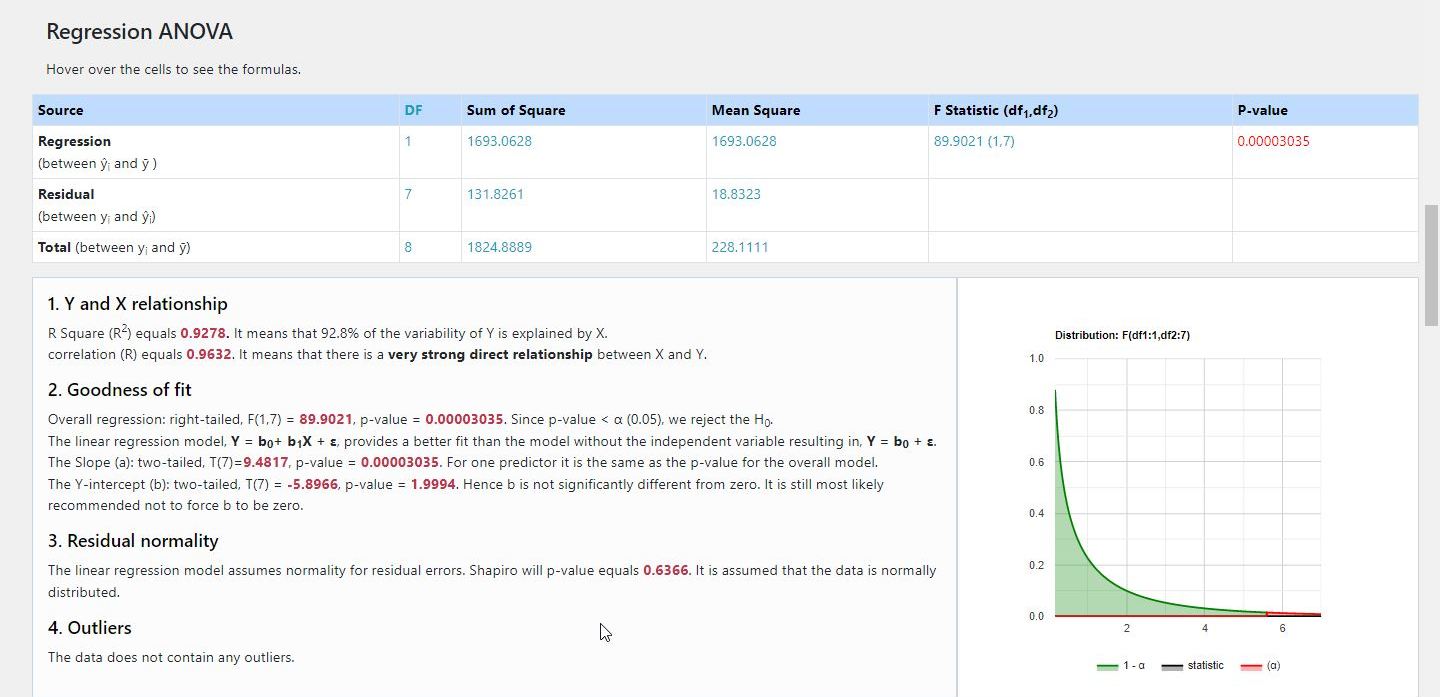
there's lots of information in the output.
what you probably want to concentrate on is the following:
regression line is y = 64.3478 * x - 284.6957.
p-value = .0003 which is < than .05, indicating the results are significant.
r^2 = .9278, indicating that most of the data results from the relationship between the variables.
r = .9632, indicating a strong positive relationship exists.


when you find your missing data, you can run the regression calculator yourself, although i doubt, from what is already there, that the results will be different.
however, just to be sure, i would run the analysis with the missing data, and i recommend you do the same.
|
|
|