|
Question 118337: graph the system
y is less than or equal to x+1
y is greater than or equal to 2x-1
Answer by bucky(2189)   (Show Source): (Show Source):
You can put this solution on YOUR website! Given:
.

.
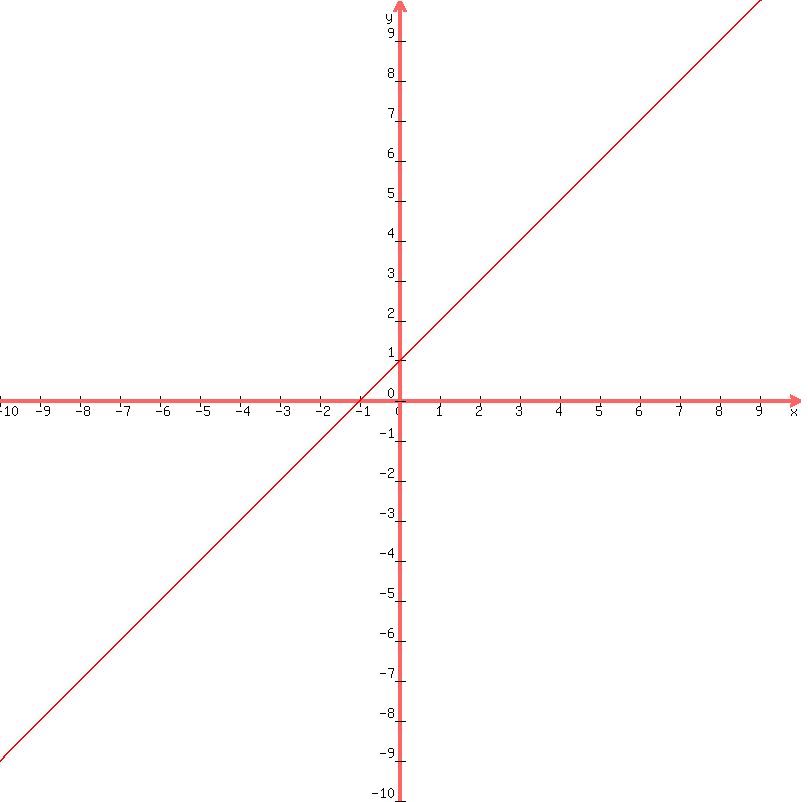
You can graph the equation  by assigning various values for x and computing by assigning various values for x and computing
the corresponding values of y. Do this for 3 or more convenient values of x and plot the
resulting (x, y) points. For example:
.
When x = 0 then y = 0 + 1 = 1
.
This tells you that the (x, y) point (0, 1) is on the graph. Plot it.
.
When x = 5 then y = 5 + 1 = 6.
.
This tells you that the (x, y) point (5, 6) is on the graph. Plot it.
.
And when x = -5 then y = -5 + 1 = -4.
.
This tells you that the (x, y) point (-5, -4) is on the graph. Plot it.
.
The three points should lie on a straight line ... so you can take a straight edge and
extend a line through these three points. If you do you should get a graph that looks like:
.
.
But this line is for the equation y = x + 1 and the problem requires that y can also be
less than the values of y represented by this line. Therefore, the usual practice is
to shade in the entire area below this line ... up to and including the line itself.
In this shaded area, any (x, y) point that you select will have a y-value that is less
than its corresponding x value + 1.
.
The second inequality you are given is:
.

.
Use the same process on this inequality as was done for the previous one. First select three
convenient values of x. Then calculate the corresponding values of y from the equation:
.

.
When you have the three (x, y) points, plot them, and using a straight edge, extend a line
through them. This graph is for the equation  and it should look like this: and it should look like this:
.

.
But this if for the equation. You are also told that y can have any value that is also
greater than the value represented by this line. So shade in the area above this line all the
way down to and including the line.
.
The solution that is common to this set of inequalities will be where the two shaded areas
overlap. With the two graphed lines on the same set of axes, the plot will be:
.

.
The shading will be below (and including) the rust-red line, and above (and including) the
green line. [The rust-red line is for  and the green line is for and the green line is for  . .
.
Try to visualize the shading and maybe you can recognize that the common shading starts where
the two graphs cross and as you move to the left, it is the region between the rust-red and
green lines and includes the graphed lines that bound that region.
.
Any point that is in that common shaded area ... including points on the graphs that form the
vee-shaped shaded area will satisfy both inequalities because they will have y values that
are less than or equal to x + 1 and are also greater than or equal to 2x - 1.
.
Hope that this helps you to understand the problem a little better and how you can solve it
graphically.
.
|
|
|
| |