Question 1182153: Given the graph below, determine a sine function and cosine function that can be used to represent the graph. Show all your work.
https://docs.google.com/document/d/1Cl3HrcoR6jibNzxfDTIilS3imSplLY8nQUU0OpU9vLA/edit?usp=sharing
Found 2 solutions by math_tutor2020, greenestamps:
Answer by math_tutor2020(3817)   (Show Source): (Show Source):
You can put this solution on YOUR website!
We can use this template
y = A*sin(B(x-C)) + D
where,
|A| = amplitude
B = is tied to the period T such that B = 360/T in degree mode
C = horizontal phase shift
D = vertical shift, aka midline
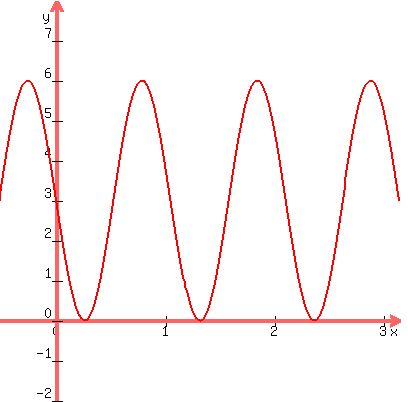
From the graph, we see that the highest point is at y = 6 and the lowest is at y = 0. The midpoint is y = 3, which is the value of D.
The vertical distance from y = 3 to y = 6 is 3 units, so that's our A value. It's the amplitude. In other words, it's half the vertical distance from peak to valley.
The first peak seems to occur at (45,6) and the second peak appears to occur at (105,6)
The horizontal distance between peaks is 105-45 = 60 units. This is the period.
The graph repeats itself every 60 units. Ie, the length of one cycle is 60 units.
So T = 60, which means B = 360/T = 360/60 = 6
We'll handle C later.
So far we found that,
A = 3
B = 6
D = 3
Which will make us go from
y = A*sin(B(x-C)) + D
to
y = 3*sin(6(x-C)) + 3
Let's see what happens when we plug (x,y) = (15,0) and solve for C
y = 3*sin(6(x-C)) + 3
0 = 3*sin(6(15-C)) + 3
0 = 3*sin(90-6C) + 3
3*sin(90-6C) + 3 = 0
3*sin(90-6C) = -3
sin(90-6C) = -3/3
sin(90-6C) = -1
90-6C = arcsin(-1)
90-6C = 270
-6C = 270-90
-6C = 180
C = 180/(-6)
C = -30
This is one potential phase shift we could use. It turns out there are infinitely many phase shifts because the graph repeats itself infinitely many times.
One potential function is
y = 3*sin(6(x+30)) + 3
which is the same as
y = 3sin(6x+180) + 3
Confirmation graph:
https://www.desmos.com/calculator/ewlz46lino
Click on the curve to have the min and max points show up. It will also plot the y intercept point as well, in addition to the x intercepts (aka roots).
In this case, the roots and min points are the same.
Clicking on any given point will have its x,y coordinates show up.
If you go with cosine instead of sine, then one potential answer is
y = 3cos(6(x+15))+3
which is the same as
y = 3cos(6x+90)+3
Any cosine graph is a phase shifted version of sine, and vice versa. It's not a coincidence that "sine" is part of the name "cosine", as both curves are sinusoidal, meaning that they have sine like qualities.
Answer by greenestamps(13203)  (Show Source): (Show Source):
You can put this solution on YOUR website!
(1) Sine function
d is the midline. From the graph, d=3
a is the amplitude -- positive difference between the midline and the maximum or minimum. From the graph, a=3
b determines the period; the period is 360/b. On the graph, one period, as measured between consecutive maxima, is 60 degrees. 360/b=60, so b=6.
c is the phase shift. For a sine graph, at 0 the function is at the midline and increasing. The graph shows this occurring at x=30 degrees, so the phase shift c is 30.
We have a=3; b=6; c=30; d=3. The function is
A graph (with the angle in radians)....

(2) Cosine function
Compared to the sine function, for the cosine function parameters a (amplitude), b (period), and d (midline) will be the same as for the sine function; the only parameter that is different is c (phase shift).
For a cosine function, at 0 the function is at a maximum. The graph shows the first maximum for a positive angle occurring at 45 degrees. So for the cosine function the phase shift c is 45 degrees.
A graph (with the angle in radians)....
The graphs of these sine and cosine functions are identical, and they are the same as the given graph.
|
|
|