Question 1177681: Determine which country occupied the given position. The 3rd quartile in consumption. Here are the consumption numbers per country.
China 109.6
United States 97.5
Russia 32.8
Canada 13.5
India 23.6
Brazil 11.7
The book says the answer is the United States, however, I have tried to get this answer in several ways and can not seem to get it. Please explain in detail. Thank you.
Answer by Theo(13342)   (Show Source): (Show Source):
You can put this solution on YOUR website! the problem with quartiles is that they are calculated using several different methods.
using one of the methods, i get:
Q1 = 13.5
Q2 = 28.2
Q3 = 97.5
this means that 25% of the data is between the minimum value and 13.56 (the first quartile) and 25% of the data is between 13.5 and 28.2 (the second quartile), and 25% of the data is between Q2 and Q3 (the third quartile) and 25% of the data is between Q3 and the maximum value (the fourth quartile).
Q1 is the dividing line between the first quartile and the second quartile.
Q2 is the dividing line between the second quartile and the third quartile.
Q3 is the dividing line between the third quartile and the fourth quartile.
using this method, the united states is right at Q3, which means it could be considered as being in the third quartile and / or being in the fourth quartile.
there is another method that will give you a different value for Q1 and Q2 and Q3.
using that method, you would get:
Median: 28.2
Minimum: 11.7
Maximum: 109.6
First quartile: 13.05
Third quartile: 100.525
Q1 is equal to 13.05
Q2 is equal to 28.2
Q3 is equal to 100.525
this means that:
13.05 is the dividing line between the first and second quartile.
28.2 is the dividing line between the second and third quartile.
100.525 is the dividing line between the third and fourth quartile.
the united states value of 97.5 which puts in between 28.2 and 100.525, making it clearly in the third quartile.
in both methods, you have to order in ascending order of value.
the data is ordered as follows:
data point 1 = 11.7
data point 2 = 13.5
data point 3 = 23.6
data point 4 = 32.8
data point 5 = 97.5
data point 6 = 109.6
the first method is done as follows:
there are 6 data points total.
Q2 is the average of the data between data points 3 and 4.
Q2 is therefore (23.6 + 32.8) / 2 = 28.2
there are 3 data points below 28.2
they are data points 1, 2, 3
the median data point is data point 2.
that makes Q1 the value for data point 2.
Q1 is therefore equal to 13.5
there are 3 data points above 28.3
they are data points 5, 6, 7.
the median data point is data point 6.
that makes Q3 the value for data point 5.
Q3 is therefor equal to 97.5
the following online calculator does it using method 1.
https://www.calculatorsoup.com/calculators/statistics/quartile-calculator.php
your inputs to this calculator are shown below.
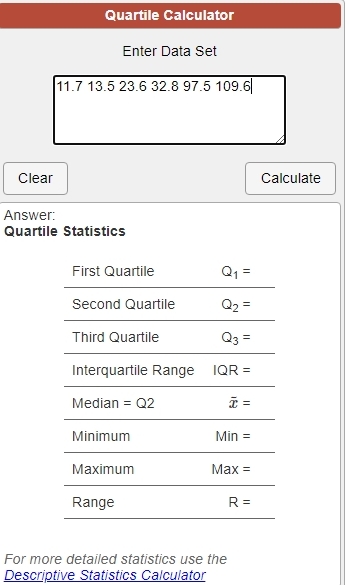
your output from this calculator is shown below.

the second method is done as follows:
there are 6 elements in total.
you get n = 6 total data elements.
you get n + 1 = 7 total data elements plus 1.
n + 1 is used in the calculations.
Q2 data point is .5 * 7 = data point 3.5.
the data for data point 3 is 23.6
the data for data point 4 is 32.8
the data for data point 3.5 is (32.8 - 23.6) * .5 + 23.6 = 28.2
Q2 data value is 28.2
notice this gets you the same value as derived using the first method.
Q1 data point is equal to .25 * 7 = data point 1.75.
the data for data point 1 is 11.7
the data for data point 2 is 13.5
the data for data point 1.75 is (13.5 - 11.7) * .75 + 11.7 = 13.05
Q1 data value is 13.05
Q3 data point is equal to .75 * 7 = data point 5.25
the data for data point 5 is 97.5
the data for data point 6 is 109.6
the data for data point 5.25 is (109.6 - 97.5) * .25 + 97.5 = 100.525
Q3 data value is 100.525
the following online calculator does it using method 2.
http://www.alcula.com/calculators/statistics/box-plot/
your inputs to this calculator are shown below.

your output from this calculator is shown below.

the instructions for this second method calculator are shown below.

these instructions are not that clear cut and it took me a while to figure out how they are doing it.
once i figured it out, i was able to duplicate their answers.
keep in mind that these are two methods, most probably the most common two methods.
excel uses another method that will give you different values for Q1, Q2, and Q3.
the results of using excel are shown below:

i didn't try analyze their method to determine how they're going it.
i only showed this to let you know that there are more than the two methods i described above.
using excel, the united states data is 97.5 which puts it into the fourth quartile, if you assume that Q3 is the dividing line between the second third quartile and the fourth quartile.
so, .....
pick your poison.
the answer depends on which method you use.
i would go with th4 second method since that puts the united states in the third quartile.
first method puts the united states right on the borderline between the third quartile and the fourth quartile.
excel method puts the united states in the fourth quartile.
good luck finding out which one is the official method that is accepted by everybody.
the second method gives you the answer you want.
|
|
|