Question 1174869: I know this question has appeared before on here and it's kind of been semi-answered but I still don't understand any of it. So can someone please help me with the following question and how to do and understand each step?
Question: An instructor gives a 100 point exam in which the grades are normally distributed. The mean is 60 and the standard deviation is 10. If there are 5% A's and 5% F's, 15% B's and 15% D's and 60% C, find the scores that divide the distribution into those categories.
Answer by Theo(13342)   (Show Source): (Show Source):
You can put this solution on YOUR website! i understand this problem in the following manner.
5% got an A.
15% got a B.
15% got a D.
5% got an F.
that's a total of 40%.
that leaves 60% that got a C.
in the normal distribution, this would translate to:
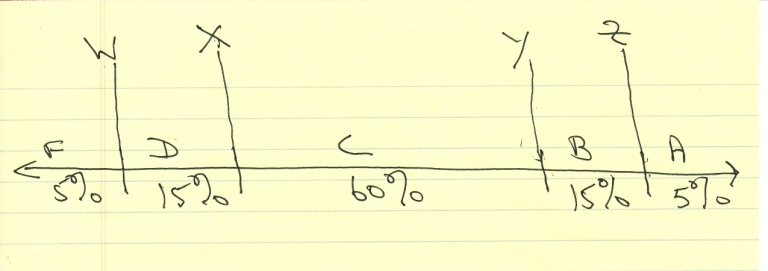
if we let the score that is the dividing line between an F and a D be equal to W and we let the score that is the dividing line between a D and a C be equal to X and we let the score that is the dividing line between a C and a B be equal to Y and we let the score that is the dividing line between a B and an A be equal to Z, then we get the following distribution.
5% got a score to the left of W.
15% got a score between W and X.
60% got a score between X and Y.
15% got a score between Y and Z.
5% got a score to the right of Z.
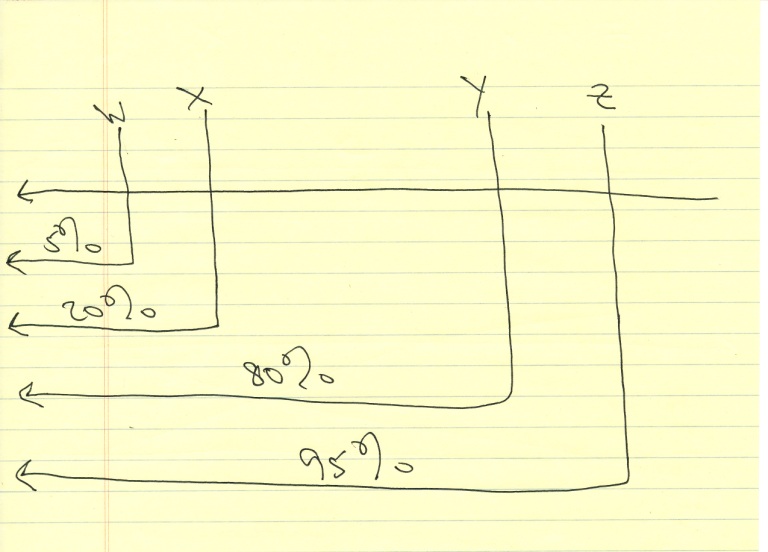
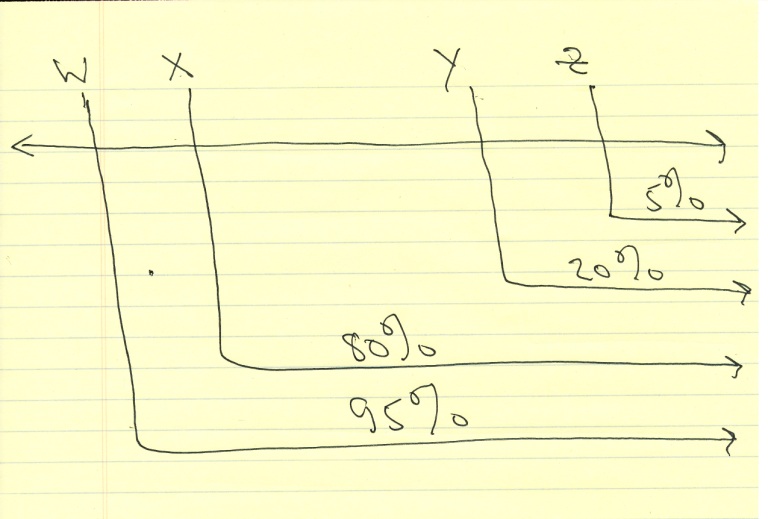
going one step further, we can look at it in the following way:
5% got a score to the left of W and 95% got a score to the right of W.
20% got a score to the left of X and 80% got a score to the right of X.
80% got a score to the left of Y and 20% got a score to the right of Y.
95% got a score to the left of Z and 5% got a score to the right of Z.
i drew some diagrams of what this looks like.
they are shown below.
the z-score tables are designed to tell you the area under the normal distribution curve to the left of a z-score.
the z-score is a way of standardizing the scores so that all normal distributions with a mean and a standard deviation can be analyzed using the same table.
the formula for the z-score is:
z = (x - m) / s
z is the z-score
x is the raw score.
m is the raw mean.
s is the raw standard deviation.
if you look in the z-score table, the numbers in the table tell you the area under the normal distribution curve to the left of the z-score indicated.
if you know the area to the left of the desired z-score, you can use the table to find the z-score associated with that.
the problem with the tables is that the areas to the left of the z-scores are not always exactly what you are looking for.
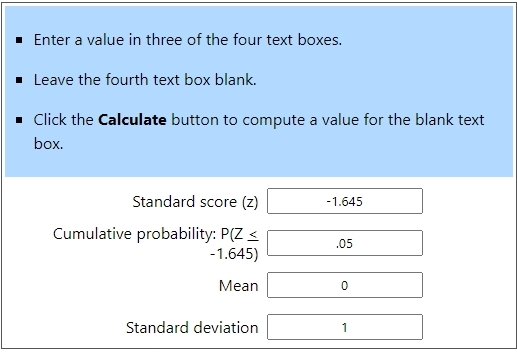
there is a calculator on line that simulates the use of the tables and finds the value you are looking for without you having to interpolate between areas that are not exactly what you are looking for.
such a calculator for z-score can be found at https://stattrek.com/online-calculator/normal.aspx
using this calculator, we find that:
the z-score associated with an area of 5% to the left of W is -1.645
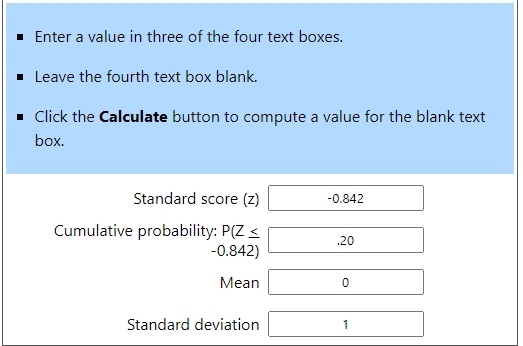
the z-score associated with an area of 20% to the left of X is -.842
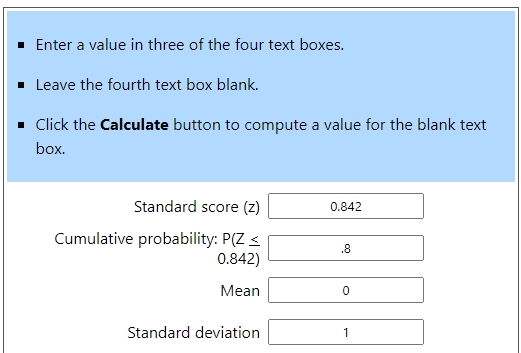
the z-score associated with an area of 80% to the left of Y is +.842
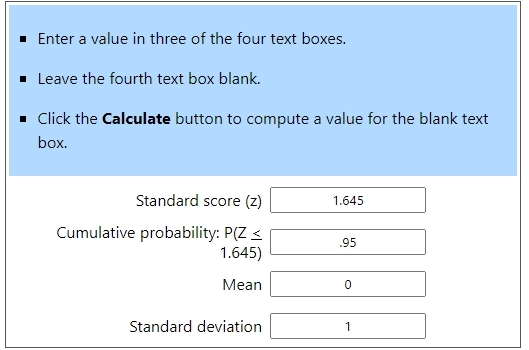
the z-score associated with an area of 95% to the left of Z is +1.645
the results from using that calculator are shown below:
we now want to associate these z-scores to raw scores.
we use the z-score formula to do that.
we are given that the mean is 60 and the standard deviation is 10.
in the z-score formula, this means that m = 60 and s = 10.
since we know the z-scores, we use the formula to find the raw scores.
when z = -1.645, the formula becomes -1.645 = (x - 60) / 10.
solve for x to get x = 10 * -1.645 + 60 = 43.55.
when z = -.842, the formula becomes -.842 = (x - 60) / 10.
solve for x to get x = 10 * -.842 + 60 = 51.58.
when z = .842, the formula becomes .842 = (x - 60) / 10.
solve for x to get x = 10 * .842 + 60 = 68.42.
when z = 1.645, the formula becomes 1.645 = (x - 60) / 10.
solve for x to get x = 10 * 1.645 + 60 = 76.45.
the students who got an F has a score less than 43.55.
the students who got a D had a score between 42.5 and 51.58.
the students who got a C had a score between 51.48 and 68.42.
the students who got a B had a score between 68.42 and 76.45.
the students who got an A had a score higher than 76.45.
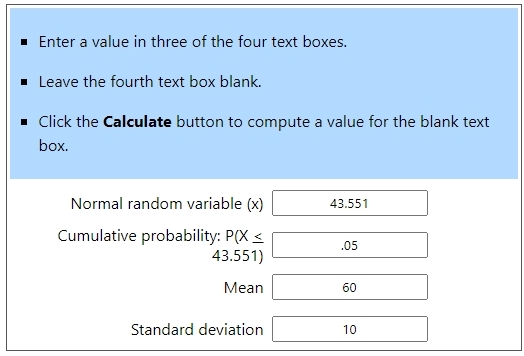
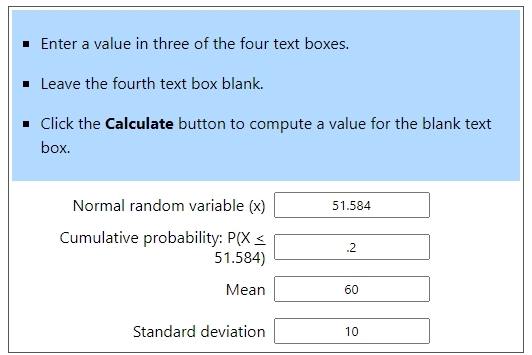
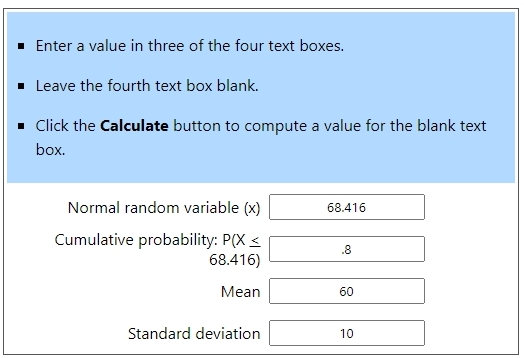
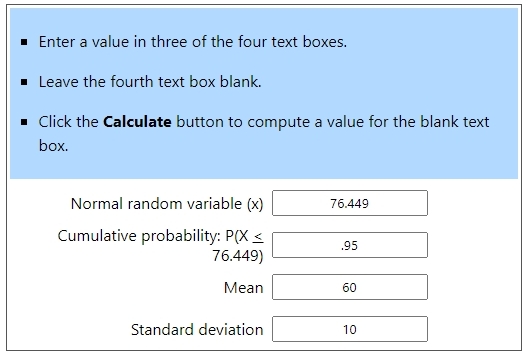
the calculator reference above can even get you the raw scores directly.
in that case, you would enter 60 for the mean and 10 for the standard deviation instead of 0 for the mean and 1 for the standard deviation.
the results of using that calculator to find the raw scores directly are shown below:
hopefully this will help you to understand better what's going on.
i will be available to answer any questions you might still have about this.
theo
|
|
|