Question 1157924: The transport department is collecting information about traffic levels on the SouthEast Freeway. Yesterday they placed a traffic data collection instrument at a particular location along the motorway. The instrument reported that the number of cars passing each minute varied linearly between 6:30am and 7:30am, and then quadratically (of the form at2 + bt) from 7:30am until 8am. The datashowedthat90carspassedthedatacollectorat7am, whileat7:30am150carspassedin1minute; at 8am, there were 360 cars passing in 1 minute. (The problem text probably means that 90 cars passed in the 1 minute between 7:00am and 7:01am)
(a) Assign a variable to be the number of cars passing the data collection instrument in any minute, and a variable to represent the number of minutes after 6:30am.
(b) Find the function that relates these two variables, and graph the function.
(c) How many vehicles were passing the data collection instrument at 6:30am? At 7:50am?
(d) For the linear part of the graph, explain the meaning of the slope in the context of how many cars were passing.
Answer by KMST(5396)   (Show Source): (Show Source):
You can put this solution on YOUR website! EDIT #1: Quick edit of unintentionally posted unfinished, uncorrected answer.
EDIT #2: Completed missing parts of the answer.
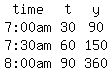
The data showed that 90 cars passed the data collector at 7am, while at 7:30am 150 cars passed in 1 minute.
At 8am, there were 360 cars passing in 1 minute.
I interpret that as the number if cars passing in 1 minute was considered as passing at 7:00am (or any other time listed) if they passed during a 1-minute period that had the exact time stated at the beginning, the end, or somewhere in the middle.
The text says that from 7:30am until 8am the number of cars passing per minute will vary as  , using , using  as the variable to represent time. (The letters a, and b obviously represent constants) as the variable to represent time. (The letters a, and b obviously represent constants)
(a) Assign a variable to be the number of cars passing the data collection instrument in any minute, and a variable to represent the number of minutes after 6:30am.
 number of minutes after 6:30am. (The student is invited to assign a variable, but part (b) suggest that the teacher would prefer to use instead). number of minutes after 6:30am. (The student is invited to assign a variable, but part (b) suggest that the teacher would prefer to use instead).
 number of cars passing per minute number of cars passing per minute
(b) Find the function that relates these two variables, and graph the function.
It is obviously what they call a piecewise function:
linear between 6:30am and 7:30am, and then
quadratic (of the form at2 + bt) from 7:30am until 8am.
The information we have can be tabulated as
We will need to find the constant  and and  for the quadratic part of the function. for the quadratic part of the function.
Linear functions are often written a of the for y=mx+b , but to avoid confusion, I would not use the letter "b" and say the linear part will follow the form  . .
For the linear part we have two data points:
 for for  , and , and  for for  . .
From those two points we can calculate the slope as
 --> -->
Then, we can substitute into the value found and the (t,y) values for one of the points used, to find the constant p.
Using point (30,90), with t=30, y=90, we get
 --> --> --> --> --> -->
NOTE: When you type that calculation, or when you key it into a calculator,
it must be written as "(150-90)/(60-30)" because
when we see a horizontal line separating "150-90" from "60-30",
we know we are supposed to calculate first the top and bottom parts,
but in math "150-90/60-30" means  ,even if your calculator has another symbol for "divided by". ,even if your calculator has another symbol for "divided by".
For the quadratic part we have two data points:
for , and  for for  . .
If we substitute each pair of values into the quadratic function  , we can find a and b. , we can find a and b.
We get:
 --> --> , which obviously simplifies to , which obviously simplifies to
 and further to and further to  or or 
and
 --> --> --> --> or or 
 is a system of linear equations in a and b. is a system of linear equations in a and b.
Solving it, we find 
Putting both pieces of the function together, we have
y=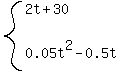 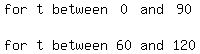 . .

(c) How many vehicles were passing the data collection instrument at 6:30am? At 7:50am?
At 6:30am,  and we use and we use  to find to find 
At 7:50am,  and we use and we use  to find to find

(d) For the linear part of the graph, explain the meaning of the slope in the context of how many cars were passing.
The slope of the linear part of the graph  means that each minute the number of cars passing per minute would increase by 2. means that each minute the number of cars passing per minute would increase by 2.
|
|
|