|
Question 115765: how do you determine linear equations and graph them?
Answer by MathLover1(20850)   (Show Source): (Show Source):
You can put this solution on YOUR website!  whether the equation is whether the equation is  or or  . .
Then graph the equation.
If the equation, for example, is

and if we subtract  from both sides, then we can write the given equation as from both sides, then we can write the given equation as

Since we can write it in the standard form,
 , ,
then we have a linear equation.
This means that we will have a  when we go to graph this. when we go to graph this.
1): find three ordered pair solutions
use a chart� then choose three  values values
here are three values I�m going to use:
 , , , and , and 
(you can pick different three values if you want)
x | y = 5x � 3 |(x, y)
-1 | y = 5(-1) - 3 = -8 |(-1, -8)
0 | y = 5(0) - 3 = -3 |(0, -3)
1 | y = 5(1) - 3 = 2|(1, 2)
2): plot the points found in step
3): draw the graph
here is the graph of my example:
| Solved by pluggable solver: Graphing Linear Equations |
In order to graph  we only need to plug in two points to draw the line we only need to plug in two points to draw the line
So lets plug in some points
Plug in x=-1

 Multiply Multiply
 Add Add
So here's one point (-1,-8)

Now lets find another point
Plug in x=0

 Multiply Multiply
 Add Add
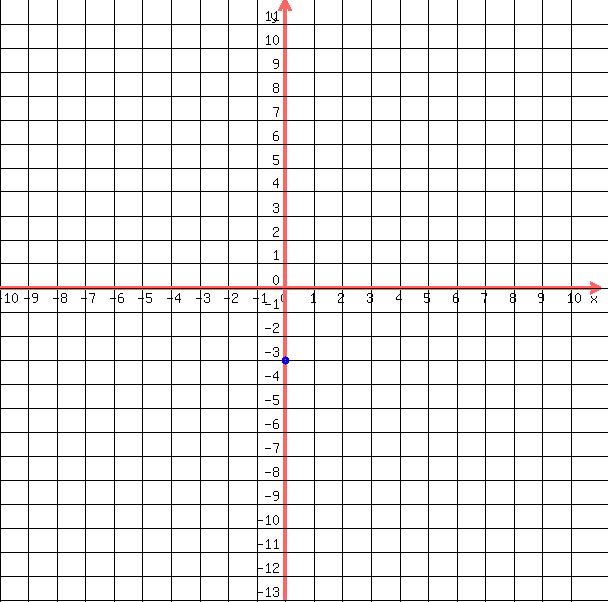
So here's another point (0,-3). Add this to our graph

Now draw a line through these points
 So this is the graph of through the points (-1,-8) and (0,-3) So this is the graph of through the points (-1,-8) and (0,-3)
So from the graph we can see that the slope is  (which tells us that in order to go from point to point we have to start at one point and go up 5 units and to the right 1 units to get to the next point) the y-intercept is (0, (which tells us that in order to go from point to point we have to start at one point and go up 5 units and to the right 1 units to get to the next point) the y-intercept is (0, )and the x-intercept is ( )and the x-intercept is ( ,0) ,or ( ,0) ,or ( ,0) ,0)
We could graph this equation another way. Since  this tells us that the y-intercept (the point where the graph intersects with the y-axis) is (0,). this tells us that the y-intercept (the point where the graph intersects with the y-axis) is (0,).
So we have one point (0,)
Now since the slope is , this means that in order to go from point to point we can use the slope to do so. So starting at (0,), we can go up 5 units

and to the right 1 units to get to our next point

Now draw a line through those points to graph
 So this is the graph of through the points (0,-3) and (1,2) So this is the graph of through the points (0,-3) and (1,2)
|
|
|
|
| |