|
Question 114462: The cost of producing a number of items x is given by C=mx+b, in which b is the fixed cost and m is the variable cost (the cost of producing one more item).
(a). If the fixed cost is $40 and the variable cost is $10, write the cost equation.
(b). Graph the cost equation.
I am really lost on how to figure this out, I would so appreciate some help.
Thank You,
Barb Neely
Answer by bucky(2189)   (Show Source): (Show Source):
You can put this solution on YOUR website! You are given that the Cost equation is C(x) = mx + b
.
Furthermore you are told that b is the fixed cost and it is $40
.
Substitute this into the cost equation for b and the Cost equation becomes:
.
C(x) = mx + 40
.
And you are told that m is the variable cost of producing one more item and that it is $10.
Substitute 10 for m and the equation is then:
.
C(x) = 10x + 40
.
This equation is the answer to part (a) of the problem.
.
To graph this equation, you plot the cost C on the y-axis and the number of units produced
on the x-axis. Note that it only makes sense to have the values of x (the number of units
produced) equal to 0 or a positive number. [How would you build or produce a negative
number of units?] Therefore, the Cost will always be a positive number. On the y-axis the
cost will be a minimum of $40 even if you produce no units. So the graph will start at $40
on the y-axis (at the (x, y) point (0, 40) and will increase from there as the number of
units produced increases.
.
You can get several points on the graph by assuming values for x and calculating the corresponding
values for the Cost on the y-axis. For example, if 1 unit is produced (that is x = 1) the
corresponding cost is given by the Cost equation as:
.
C(x) = 10(1) + 40 = 10 + 40 = 50
.
So the (x, y) point (1, 50) is another point on the graph.
.
Next you could assume that 5 units are produced ... that is x = 5. Substitute that value
into the cost equation and you have:
.
C(x) = 10(5) + 40 = 50 + 40 = 90
.
This means that the (x, y) point (5, 90) is on the graph.
.
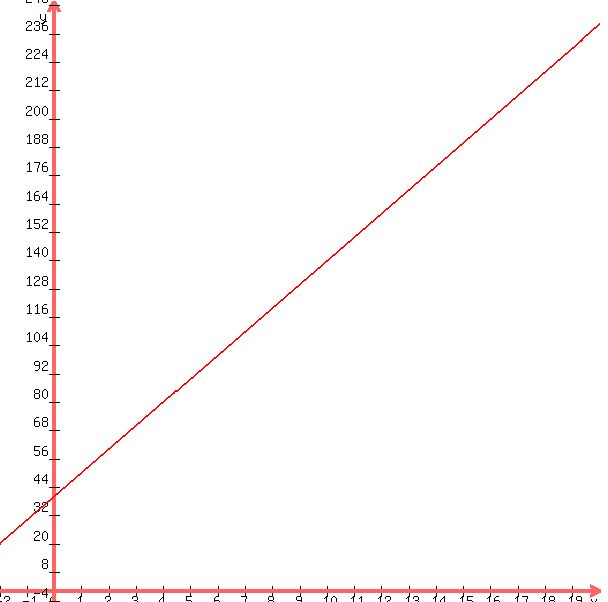
That is three points on the graph. You can plot these three points and then extend a straight
line through them to sketch the graph. When you do that you should should have a graph that
looks like:
.
.
Ignore that part of the graph that shows in the area where x is negative. The graph should
not extend to the left of the y-axis.
.
Hope this helps you to understand the problem a little better and to see your way through
to the answers.
.
.
|
|
|
| |