SOLUTION: A company manufactures x units of Product A and y units of Product B, on two machines, I and II. It has been determined that the company will realize a profit of $6/unit of Product
Algebra ->
Inequalities
-> SOLUTION: A company manufactures x units of Product A and y units of Product B, on two machines, I and II. It has been determined that the company will realize a profit of $6/unit of Product
Log On
Question 1142002: A company manufactures x units of Product A and y units of Product B, on two machines, I and II. It has been determined that the company will realize a profit of $6/unit of Product A and a profit of $7/unit of Product B. To manufacture a unit of Product A requires 6 min on Machine I and 5 min on Machine II. To manufacture a unit of Product B requires 9 min on Machine I and 4 min on Machine II. There are 5 hr of machine time available on Machine I and 3 hr of machine time available on Machine II in each work shift. How many units of each product should be produced in each shift to maximize the company's profit?
(x, y) =
What is the optimal profit? (Round your answer to the nearest whole number.)
$
it helps to set up a table like the one below that allows you to visualize what's happening.
make sure that all constraints are dealing with the same units.
constraint units are in minutes for this problem.
                                product A      product B
number of units                     x              y
profit                              6              7          maximize
machine 1                           6              9          <= 300
machine 2                           5              4          <= 180
your maximum profit will be when 20 units of product A and 20 units of product B are produced.
the maximum profit is 260 dollars.
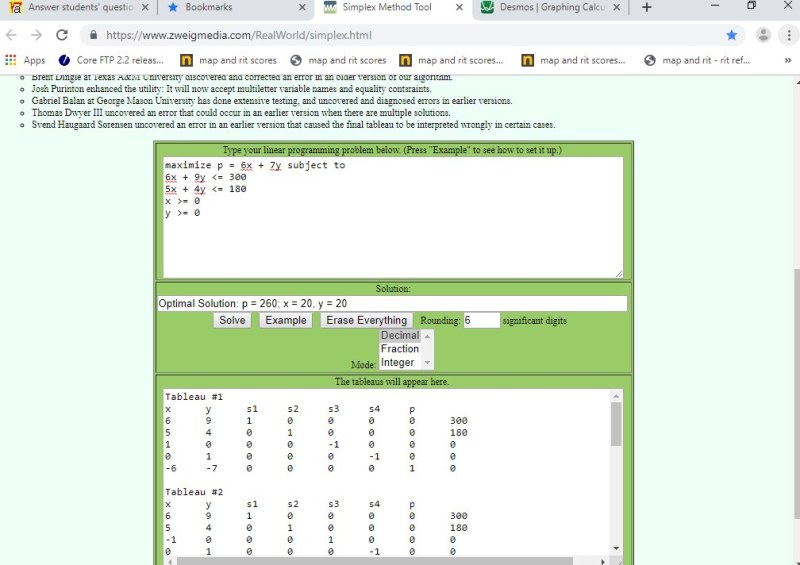
you can solve this by using a linear optimization program such as can be found at https://www.zweigmedia.com/RealWorld/simplex.html, or by using the solver that comes with excel (it's an add in on the version of excel that i'm using), or by graphing.
i did all three and got the same answer, so it looks to be good, assuming i set the problem up correctly.
the linear optimization simplex solution is shown below.
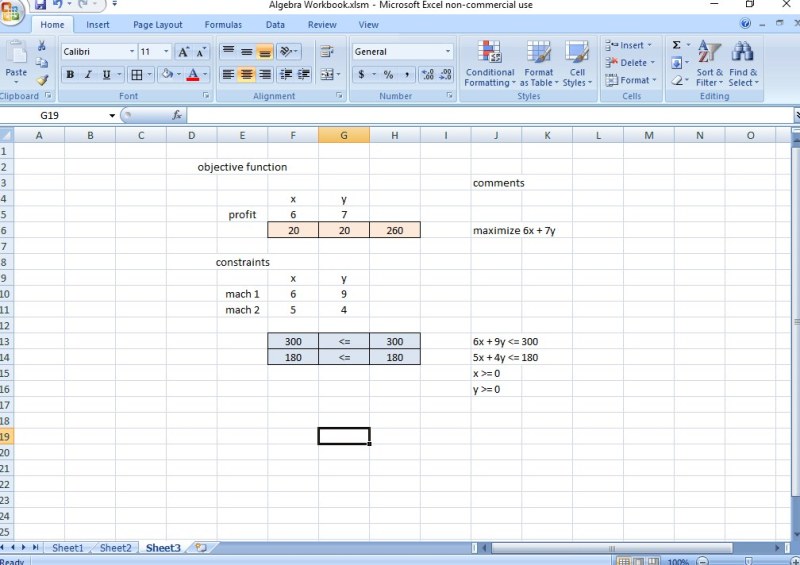
the excel solution is shown below:
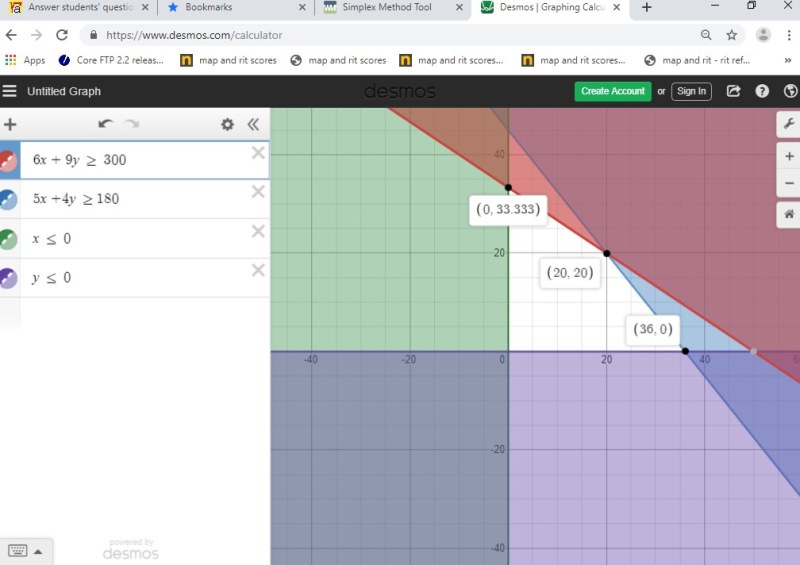
the graphical solution is shown below:
the desmos.com graphing software makes solving these types of problems easy.
using this software, you would graph the opposite of the inequalities.
the area of the graph that is not shaded is the region of feasibility.
the corner points of the region of feasibility are where the value of the objective function are evaluated.
for example, at the coordinate point of (20,20), the objective function of 6x + 7y is evaluated to get 6*20 + 7*20 = 260.
all the constraint functions have to be satisfied as well.
x and y are greater than or equal to 0.
6x + 9y = 6*20 + 9*20 = 300 which is less than or equal to 300.
5x + 4y = 5*20 + 4*20 = 180 which is less than or equal to 180.