Question 1136834: I am working with exponential regression on a homework problem and we are find an equation for a model for the given data. (Use the first and fifth sets of data from the table to calculate your equation.) Typically I would enter the data in my TI-84 Plus calculator then STAT>CALC>EXPREG and that would give the "a" and "b" values. But, since some of the values are negative I am getting an ERR:DOMAIN instead. So, how do I work out the equation when dealing with negative numbers?
The values given
x= -6,-2,2,5,7,11
f(x)= -12.06, -22.50, -51.84, -89.58, -128.99, -294.23
Answer by Theo(13342)   (Show Source): (Show Source):
You can put this solution on YOUR website! as far as i know, exponential function require the base to be positive.
the exponential function are either y = a * b^x or y = a * e^(b*x) or something like that.
i couldn't find anything to transform the data into a positive base except to reflect the equation about the x-axis.
that makes f(x) all positive.
i then used excel to find the exponential equation fit.
excel told me that the equation was y = 35.725 * e^(.187 * x).
it also told me that the R^2 was equal to .9974 which is a pretty good fit.
i then plotted the points in desmos.com calculator and then graphed the equations.
it appears the reflection method works ok.
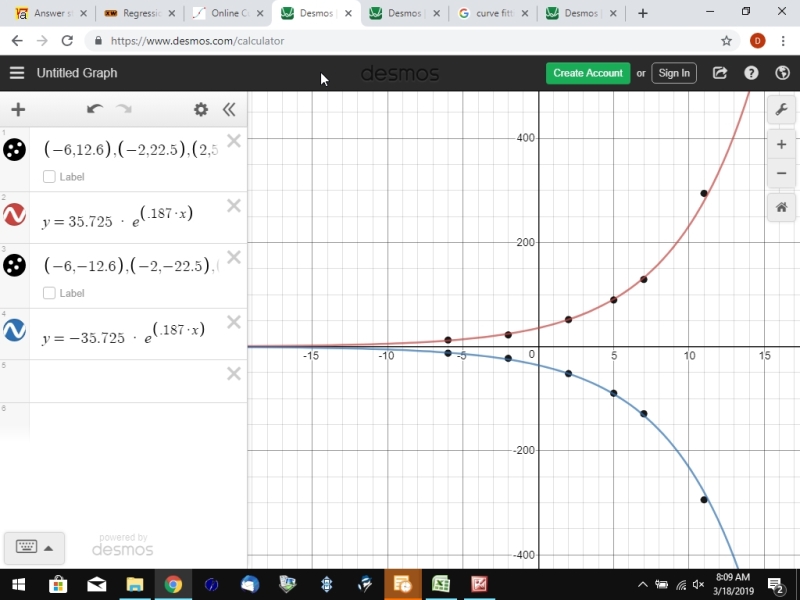
i plotted the positive f(x) points and then graphed y = 35.725 * e^(.187 * x).
the graph seems to fit the points very well.
i then plotted the negative f(x) points and then graphed y = -35.725 * e^(.187 * x).
the graph seems to fit those points very well also.
as long as all of your f(x) points were negative, this method seems to work pretty well.
i'm not exactly sure what to do if some of your f(x) points were negative and some positive, because then this method wouldn't work.
there was another exponential curve that seemed fit you data also.
i found that on another website.
that equation was y = -4.00479 - 30.15122 / (2^(x / -3.369121).
the general form of that equation was y = a + b / (2 ^ (x / c)
that seemed to fit the data well without any transformation required, although i couldn't get an R^2 on that.
one additional point you might find interesting.
i tried using polynomial equqtion in excel and was able to get a perfect fit with a fifth degree equation.
when i graph it, however, the end point behavior of the graph was totally different.
even though it fit the data points given very well (it had an R^2 value of 1), it's predictions on the left of the graph were much different because it went positive as x became more negative and did not trend toward 0 as i think you wanted it to do.
i graphed all equations and points to show you what i mean.
first graph is getting the exponential equation when all f(x) points were made positive.

second graph was plotting y = 35.725 * e^(.187) and y = -35.725 * e^(.187).
third graph was plotting y = -4.00479 -30.15122 / (2 ^ (x / -3.369121).
the general form of this equation was y = a + b / 2 ^ (x / c)

fourth graph was plotting the fifth degree polynomial equation.

while excel indicated the fit was perfect, the end behavior of the function was not anything like the exponential curve end point behavior.
what this says is that, even though the given data points were fit perfectly, trending from the equation would give you a far different projection which may or may not be accurate.
the curve fitting programs work very well with the given data, but trending from them is still a risky proposition.
bottom line:
the reflection technique seemed to work well with your data.
i also used the same technique with the equation i got from the TI-84 Plus.
using positive f(x) points, the calculator told me the equation was y = 35.26283386 * 1.208123588 ^ x.
i plotted that equation plus the reflected equation with the negative f(x) points and this is what i got.

looks like the equatioon from expreg modeled the data pretty good as well and the reflection technique worked the same.
|
|
|